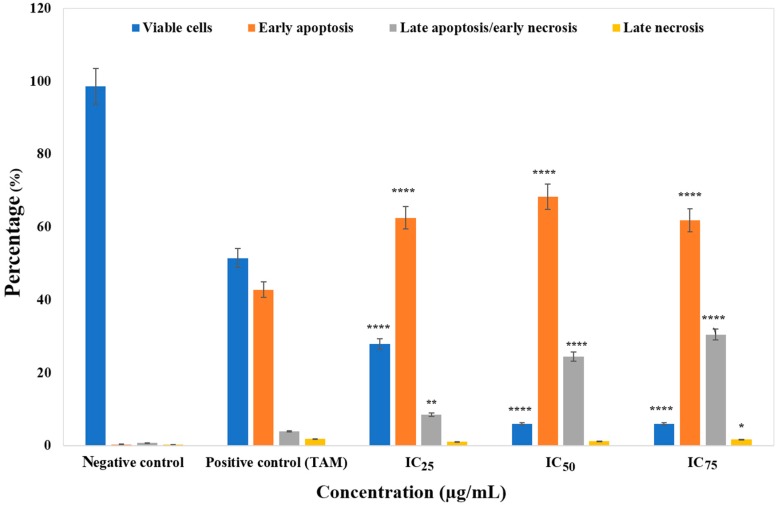
Figure 3.
The percentage of viable, early apoptotic, late apoptotic/early necrotic, and late necrotic cells with respect to negative control (untreated), positive control (tamoxifen), and MCF-7 cells treated for 24 h as determined by a flow cytometer instrument. Cells were exposed to different concentrations of ZnO NPs for 24 h. Data represent the mean ± SD (n = 3). More information on cell percentages is provided in Appendix B. * p ≤ 0.0.5; ** p ≤ 0.0; *** p ≤ 0.001; **** p ≤ 0.0001.

