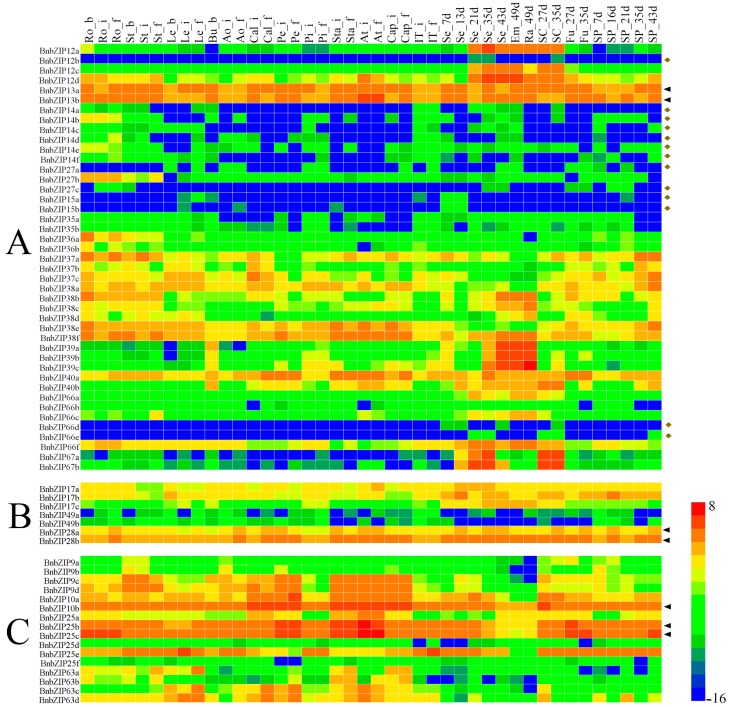
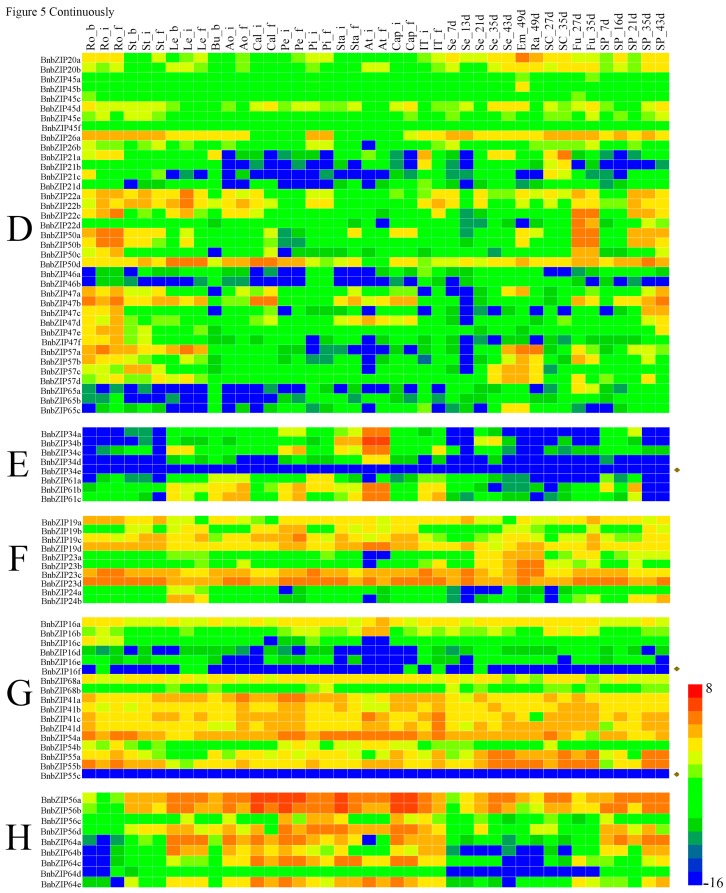
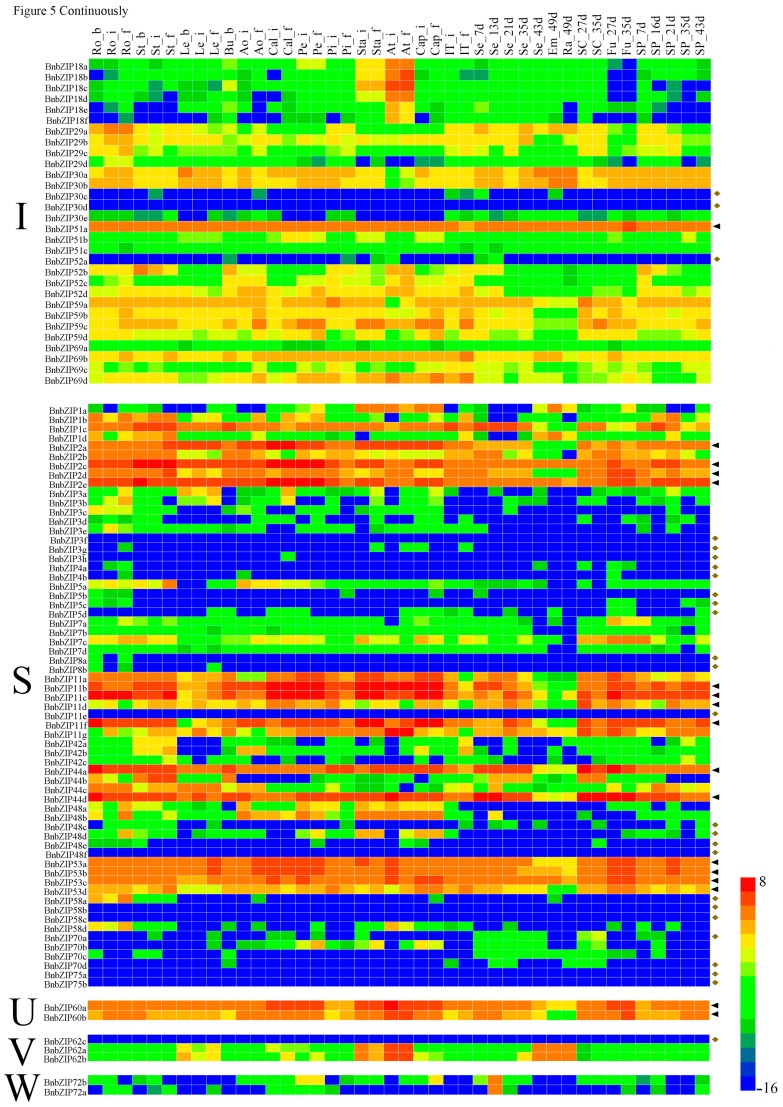
Figure 5.
Heatmap of the expression levels of B. napus bZIP transcription factor family genes during different periods of development in different tissues and organs. Each subfamily is represented by a different uppercase letter (A–I, S, U–W). The black triangles correspond to higher expression levels in all tissues during the whole development, and the yellow diamonds correspond to lower expression levels in all tissues during the whole development. The abbreviations combinations above the heatmap indicate the different tissues and organs/developmental stages from B. napus ZS11 (listed in Table S3). The “scale” function in R was used to normalize relative expression levels (R = log2/FPKM). The heatmap was generated using Heatmap Illustrator (HemI) [40].


