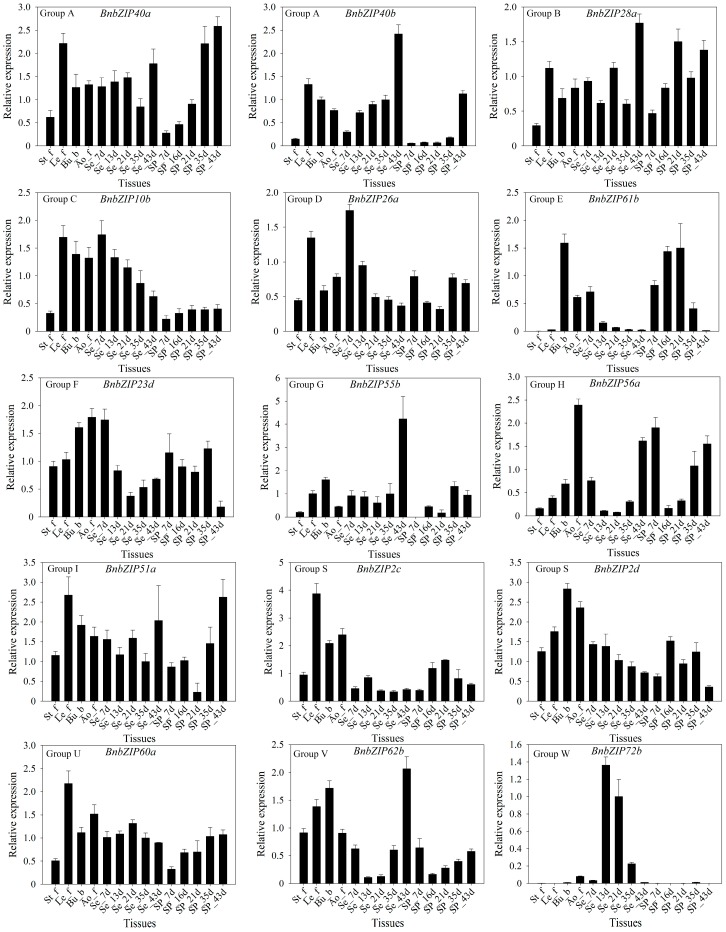
Figure 6.
The expression levels of B. napus bZIP transcription factor family genes at different developmental stages in different tissues and organs, as determined by quantitative real time PCR (qRT-PCR). The subfamily is indicated in the upper-left corner of each graph. The x axis corresponds to the different tissues and organs/developmental stages of B. napus ZS11 (listed in Table S3). BnACTIN7 (EV116054) and BnUBC21 (EV086936) were used as the reference gene [41]. Values represent the average ± standard deviation (SD) of three biological replicates with three technical replicates at each developmental stage. Error bars denote SD among three experiments.

