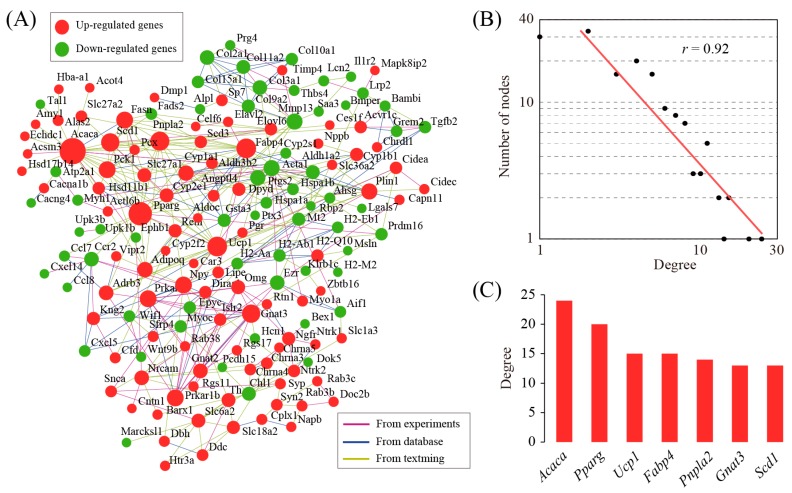
Figure 3.
Gene network analysis of differentially expressed genes. (A) The structure of gene network underlying differentially expressed genes. This analysis was performed by using the STRING software. Nodes represent genes and edges represent gene–gene interactions. The diameter of each node is proportional to its degree value. This graph was generated using the Cytoscape software; (B) The degree distribution of the network, which follows a power law distribution; (C) Identification of hub genes in the gene network.

