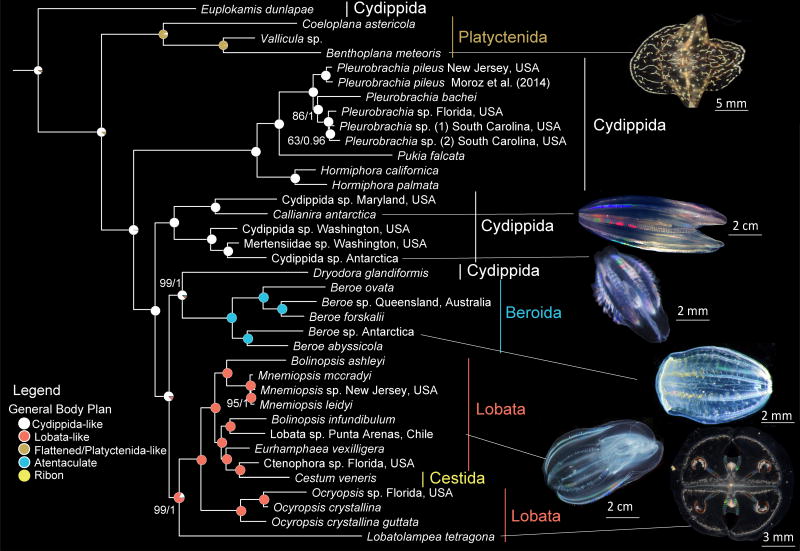
Fig. 3.
Evolutionary relationships among Ctenophora and ancestral character state reconstruction of general body plan. Traditional orders labeled with colors matching corresponding body plan morphotype. Nodes are labelled with pie charts depicting posterior probability of character states. Phylogeny was inferred with dataset Ctenophore_RCFV_LB. Lines connect photographs of exemplars with species identity. Sponge and cnidarian outgroups that were used to root the tree were removed for illustrative purposes. Nodes have 100% BS or 1.00 PP support unless otherwise noted (BS/PP).

