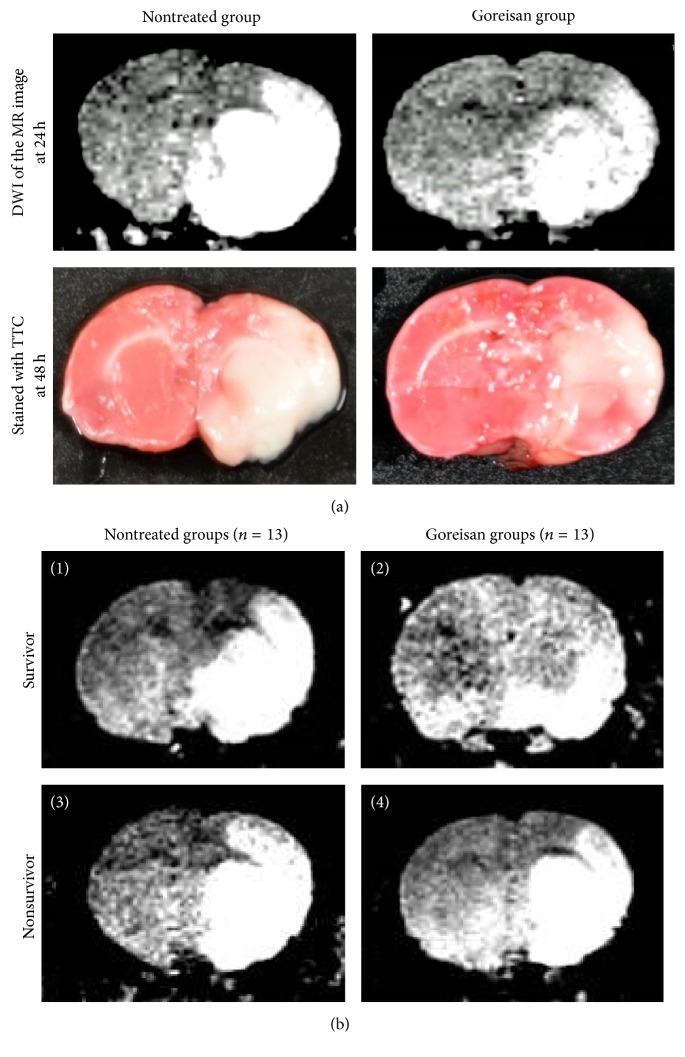
Figure 2.
Ischemic regions of right hemispheres identified using TTC staining and MRI. (a) MR images were obtained using DW imaging (DWI) at 24 h. No TTC staining was observed in the ischemic region at 48 h. The MR imaging area and unstained TTC area overlapped in the lesioned rats. (b) The DWI of survivors in the nontreated group (1) or Goreisan group (2) and nonsurvivors in the nontreated group (3) or Goreisan group (4) at 24 h. MRI revealed that the lesion area was smaller in survivors from the Goreisan group compared with the other groups.

