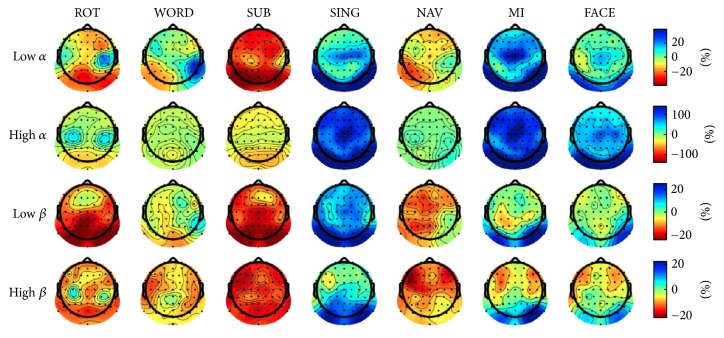
Figure 3.
ERD/ERS maps for each task in the low α, high α, low β, and high β bands. ERD/ERS values are computed using the intertrial variance method [51] over the time window spanning 0.5 to two seconds after stimulus onset, using a baseline of −2 to 0 seconds before trial onset. Blue represents ERS while red represents ERD. Note that color ranges differ between power bands.

