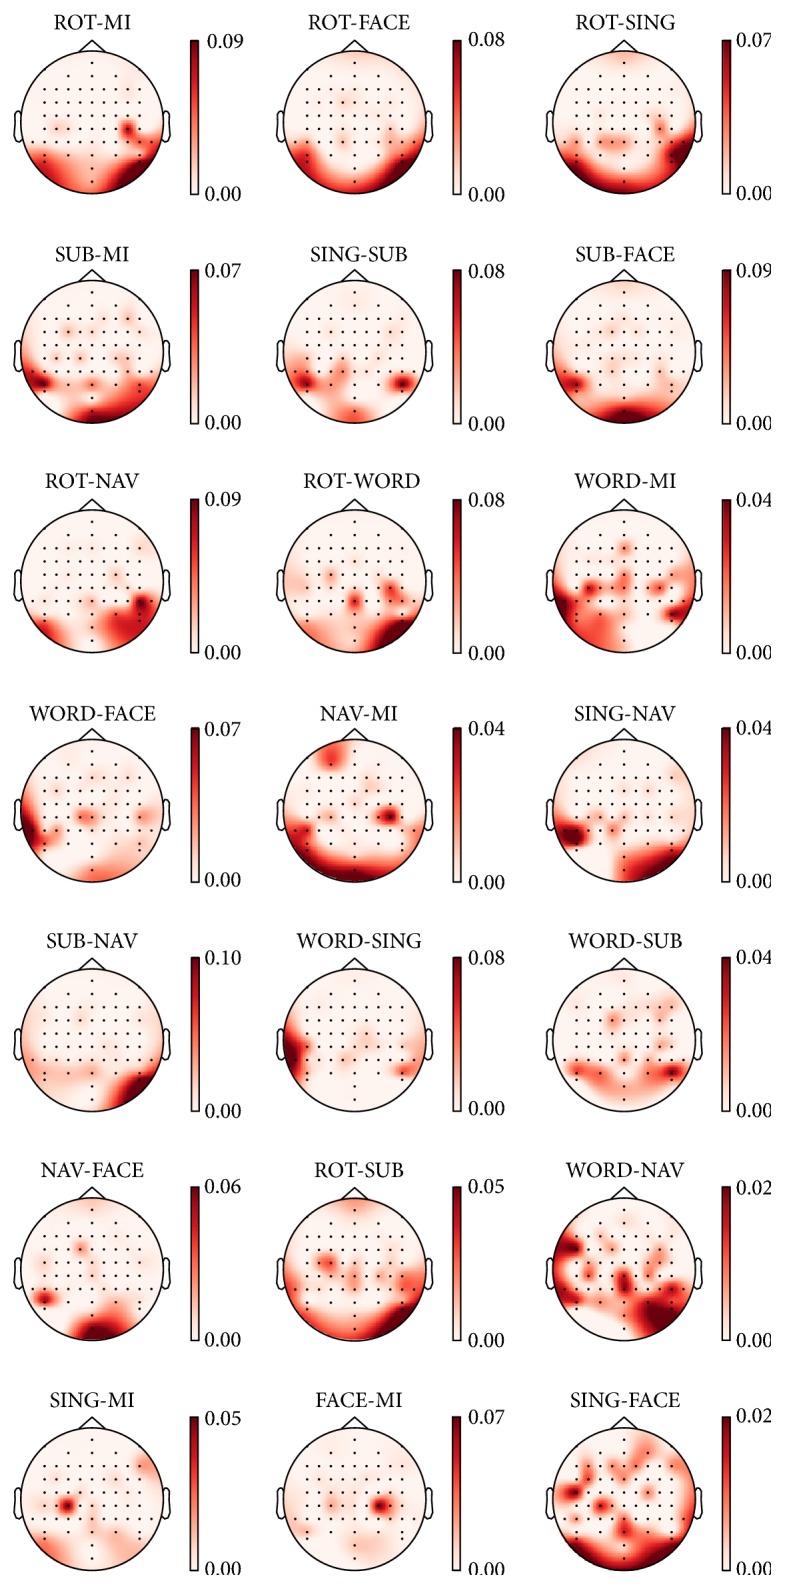
Figure 6.

Topographical maps of the average absolute value of the SVM weights, when trained on EEG features only. Darker regions are those that are more important when classifying each task pair. Note that distinct color ranges are used for each map. This figure uses the models trained on the one-second window occurring three to four seconds after stimulus onset, which corresponds to the average peak time for EEG classification (see Table 2). The pairs are plotted in descending order of average κ (left to right and top to bottom) as presented in Table 2.
