Figure 3.

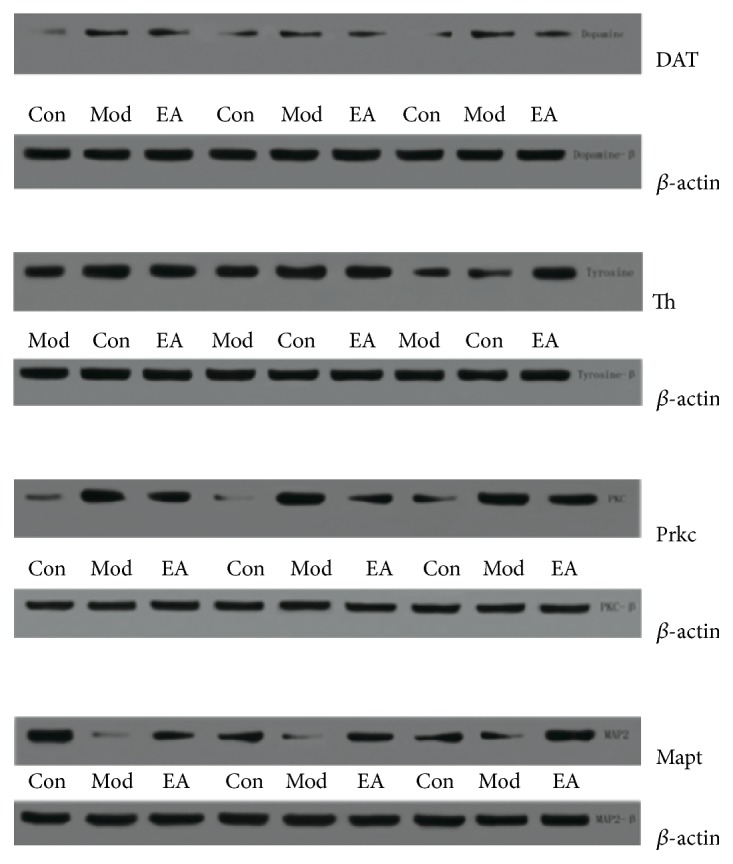
Representative Western blots showing levels of DAT, Th, Prkc, and Mapt in the hippocampus of the following groups (n = 4 per group, repeated 3 times): control, model, and EA.

Representative Western blots showing levels of DAT, Th, Prkc, and Mapt in the hippocampus of the following groups (n = 4 per group, repeated 3 times): control, model, and EA.