
Figure 7.
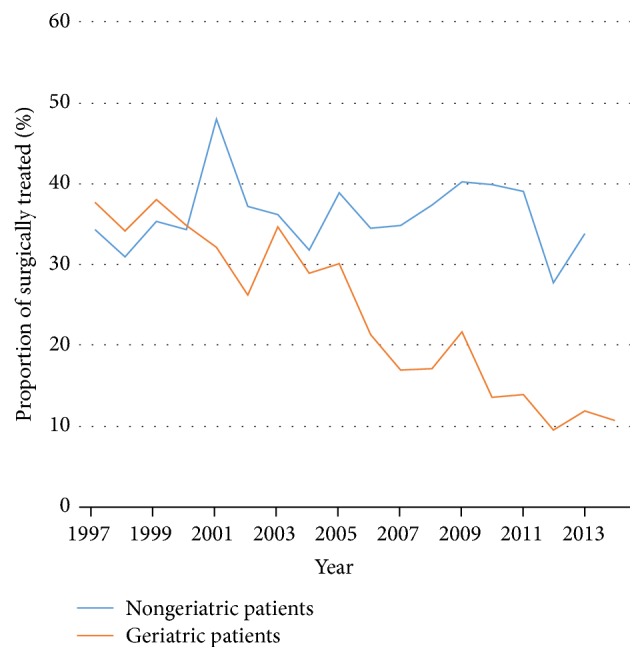
Proportion of surgically treated nongeriatric (blue) and geriatric (orange) patients with C2 fractures between 1997 and 2014.
Official websites use .gov
A
.gov website belongs to an official
government organization in the United States.
Secure .gov websites use HTTPS
A lock (
) or https:// means you've safely
connected to the .gov website. Share sensitive
information only on official, secure websites.
Proportion of surgically treated nongeriatric (blue) and geriatric (orange) patients with C2 fractures between 1997 and 2014.