
Figure 2.
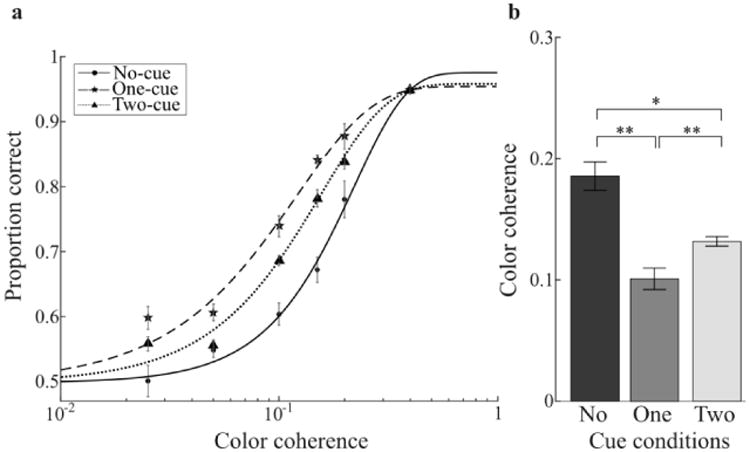
Experiment 1 results. a) Group-average psychometric function for each cueing condition. b) Color coherence thresholds evaluated at a proportion correct of 0.75. Error bars are ± s.e.m within subjects following the method of Cousineau (2005). Asterisks indicate the significance level in paired t-tests (**: p<0.01; *: p<0.05).