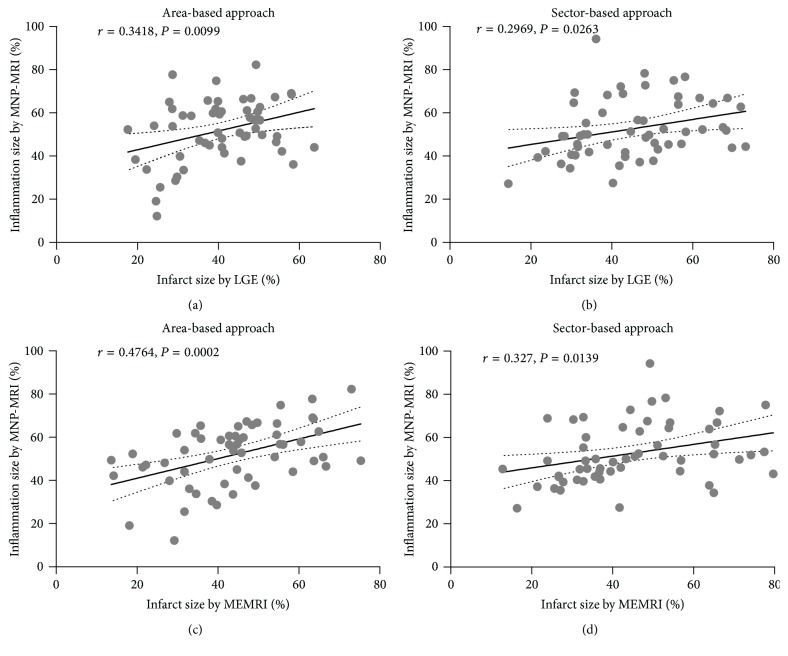
Figure 5.
Correlation between infarct lesion size based on LGE or MEMRI and inflammatory lesion size based on MNP-MRI. Pearson's correlation coefficients (r) and P values are described in the figure. Significant positive correlations between the infarct and inflammatory lesion size were observed by both area-based (a, c) and sector-based approaches (b, d). The solid line denotes the linear regression fit, and the dotted lines represent the 95% confidence limits. Each data point represents the individual enhanced size for each slice (4 slices per mouse).

