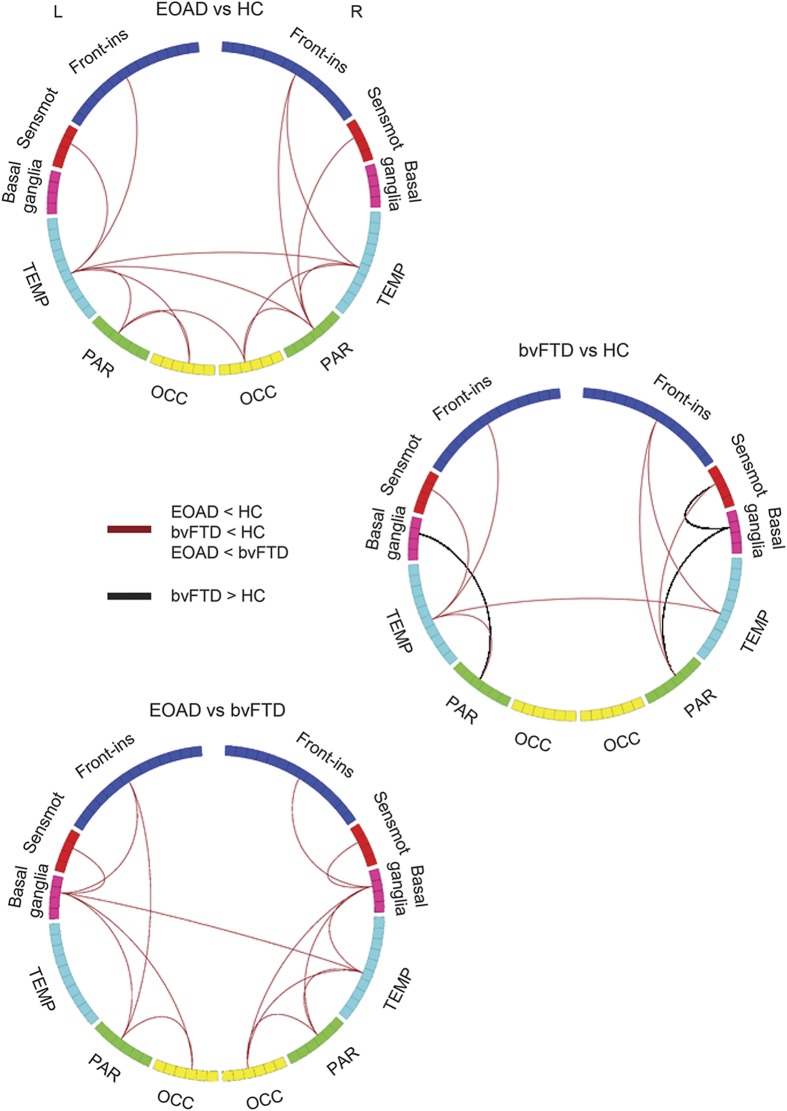
Figure 2. Intralobar and interlobar connectivity weights (LCW) in healthy controls (HC), patients with behavioral variant of frontotemporal dementia (bvFTD), and patients with early-onset Alzheimer disease (EOAD).
The figure shows the lobar regions arranged as a ring (the size of the regions being proportional to the number of brain nodes included; see table e-1 for further details). Red lines indicate decreased LCW in patients with EOAD relative to HC, patients with bvFTD relative to HC, and patients with EOAD relative to patients with bvFTD. Black lines indicate increased LCW in patients with bvFTD compared with HC. The direct comparison between patients with EOAD and patients with bvFTD was adjusted for Mini-Mental State Examination scores. Front-ins = frontoinsular; OCC = occipital; PAR = parietal; Sensmot = sensorimotor; TEMP = temporal.

