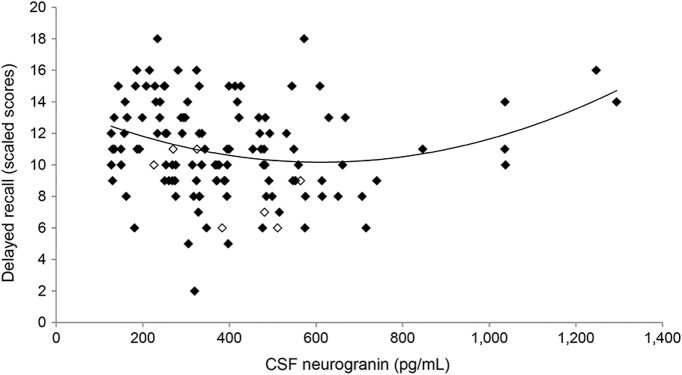
Figure 2. Scatterplot illustrates the relationship between CSF neurogranin and delayed recall performance.
n = 5 data points with CSF neurogranin >1,000 pg/mL driving the quadratic effects. Open markers denote individuals with Clinical Dementia Rating of 0.5; delayed recall scaled score is age-adjusted (mean 10, SD 3).

