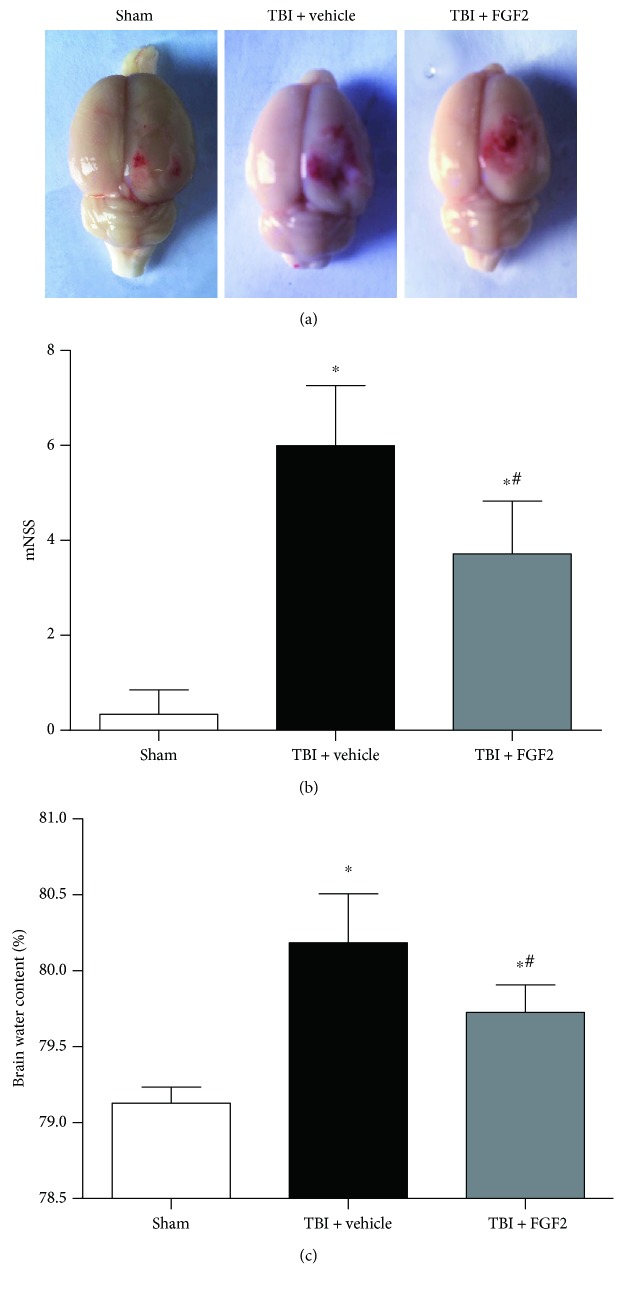
Figure 1.
Representative pictures of the brains from each group, mNSS, and brain water content at 48 h after rat mild TBI. (a) Typical brains from the sham, TBI + vehicle, and TBI + FGF2 groups. (b) The quantification of mNSS at 48 h after TBI induction. The bars represent the mean ± SD. n = 24. ∗P < 0.05 versus sham and #P < 0.05 versus TBI + vehicle. (c) The quantification of brain water content of the right hemisphere. The bars represent the mean ± SD. n = 6. ∗P < 0.05 versus sham, #P < 0.05 versus TBI + vehicle.

