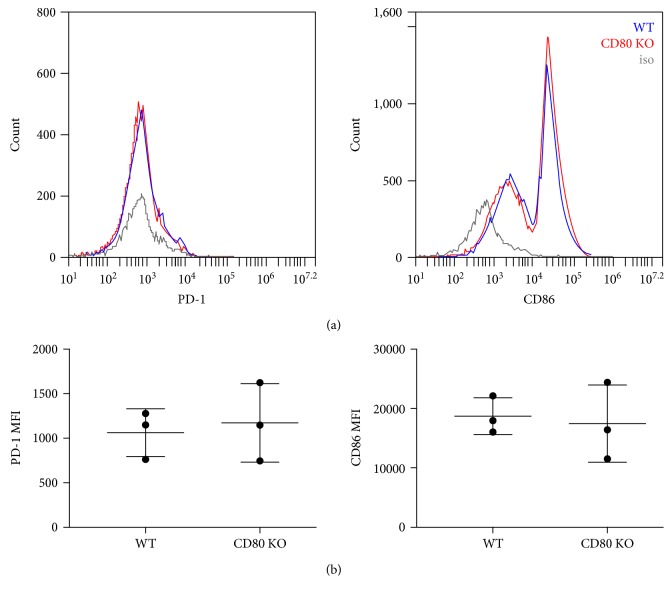
Figure 2.
CD80-KO and WT CD8+ T cells express equivalent levels of cell surface markers of activation after ConA activation. WT and CD80-KO cells were activated with ConA, then harvested for analysis. Cells were then analyzed by flow cytometry. (a) Histograms are of live CD8+ cells and representative of 3 separate experiments. (b) Mean fluorescent intensity (MFI) for PD-1 and CD86 (n = 3, ±SD, not significant).

