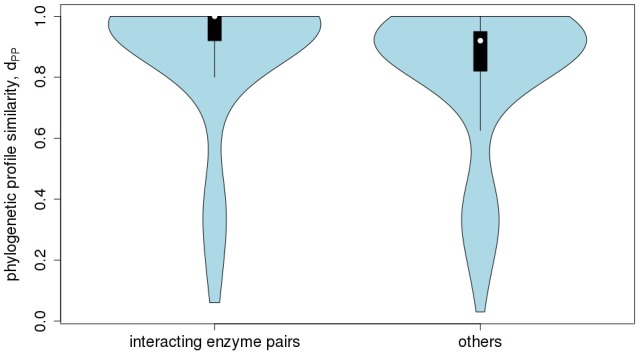
Figure 10.

Protein-protein interaction statistic. Violin-plot of the frequency distribution of phylogenetic profile similarity values, dPP, of enzyme pairs encoded in Arabidopsis thaliana reported to physically interact (median = 1) to those pairs not reported to interact (median = 0.92, p < 2.2*10−16).
