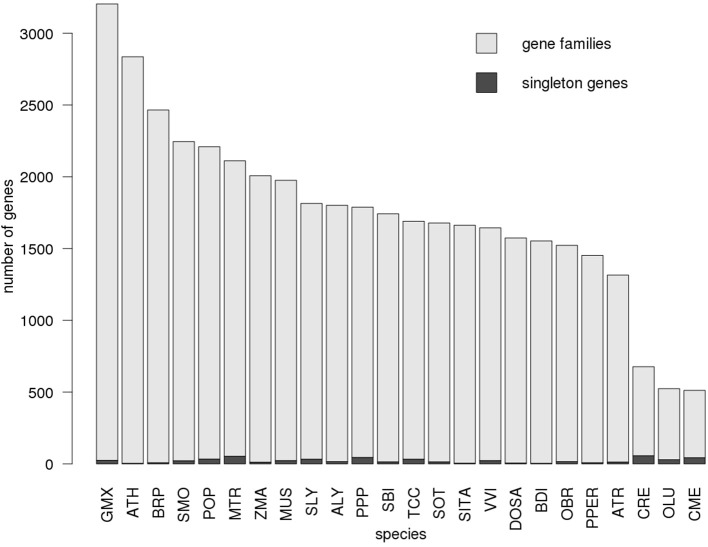
Figure 5.
Number of enzyme genes assigned to gene families. The proportion of genes assigned to gene families (light gray) as well as singleton genes (dark gray) is displayed for each plant species with available KEGG and gene annotation. The distribution is shown for gene family assignment based on the Network30 dataset. Species are sorted by the total number of genes. For every species, only genes annotated to function as enzymes were considered.

