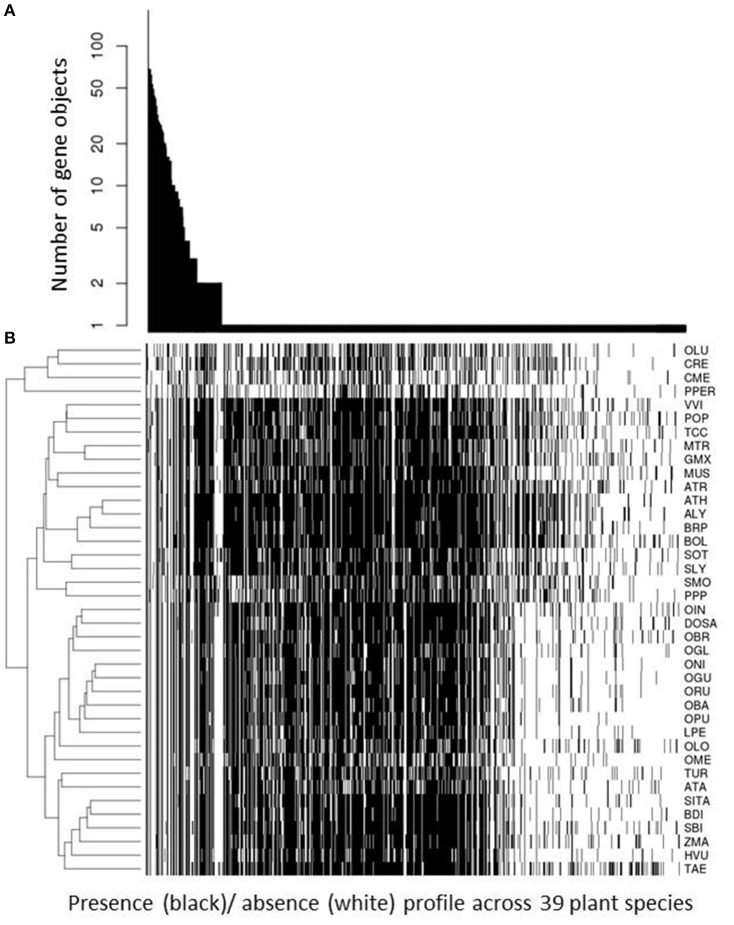
Figure 6.
Phylogenetic profile frequency statistic. For all 818 unique phylogenetic profiles, their respective occurrence; i.e. number of gene objects with this profile, is plotted in descending order of occurrence (A). The associated actual presence (black cell)/ absence (white cell) for all 39 plant species considered in this study is plotted underneath (B). Plant species are given by their abbreviation introduced in Table 1 and clustered hierarchically (complete linkage, Euclidean distance) according to similarity of presence/absence pattern. Unique profiles found for only one gene object are sorted in descending number of genes clustered into this object; i.e., from large gene families (grouped to the left) to small gene families and singleton genes (grouped to the right). Note that we used only those gene objects for which a KEGG annotation for at least one member plant was available.

