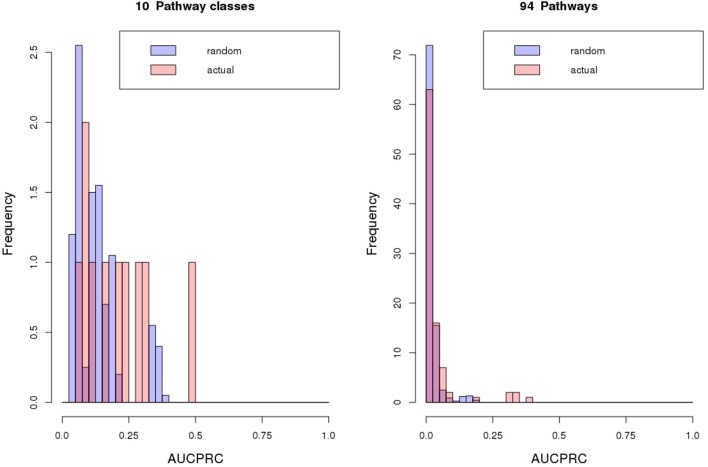
Figure 8.
Classification results. Classification results of metabolic pathway class or map assignments of gene objects based on their phylogenetic profiles using Random Forest predictions as implemented in Clus-HMC. Performance is judged by the area under the precision-recall curve (AUCPRC). For the 100/20 randomized repeats performed for pathway map or class respectively, average AUCPRC distributions are plotted. Averaged over all random repeat runs, tests for statistical difference (Wilcoxon rank sum test) between actual and random AUCPRC value distributions yielded for pathway class: mean actual = 0.2, mean random = 0.13, p = 0.22, and for pathway map: mean actual = 0.04, mean random = 0.021, p = 0.0033. Clus-HMC was used allowing multiple and hierarchically organized labels per object with the hierarchy related to metabolism class and metabolism map.

