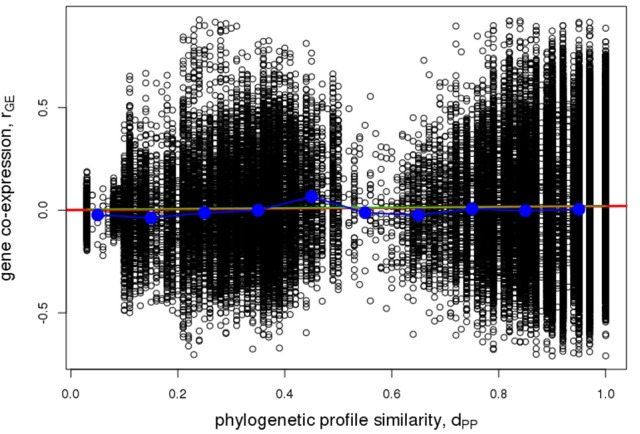
Figure 9.

Pairwise gene co-expression statistic. Association of pairwise phylogenetic profile similarity, dPP, and co-expression of Arabidopsis gene pairs as judged by their pairwise Pearson correlation coefficient, rGE. Raw pairwise data are plotted as open circles, the red line indicates the linear regression line (r = 0.022, p = 2.9*10−11), the green line corresponds to a logistic fit virtually coinciding with the linear regression line, blue circles indicate median values of binned data (bin width = 0.1 dPP units) connected by straight lines for visual guidance.
