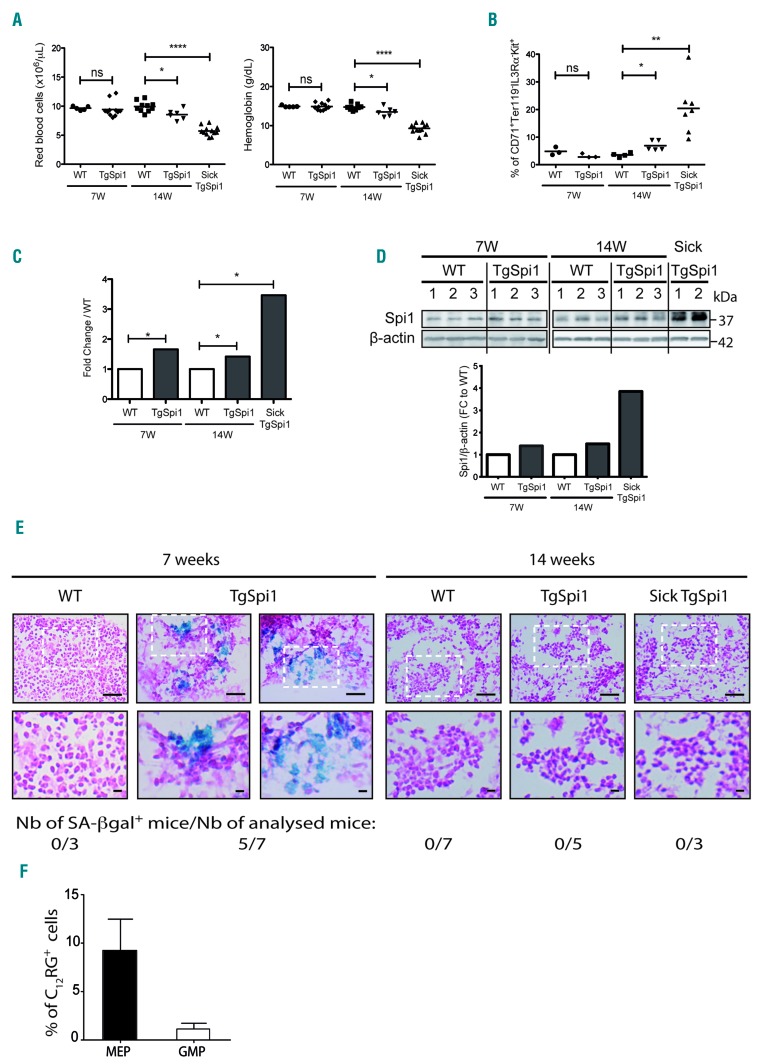
Figure 6.
Spi1 induces senescence in vivo in the bone marrow of young TgSpi1 mice and is lost before the onset of the pre-leukemic syndrome. (A) Red blood cell numbers and hemoglobin concentrations of wild-type (WT) and TgSpi1 mice at the indicated ages. Bars indicate the mean values. *P<0.05; ****P<0.0001 from two-tailed Student’s t-tests. (B) Scatter plots represent the results of flow cytometry analyses of whole bone marrow cells for CFU-E markers (CD71+Ter119−Kit+IL3Rα−) in WT and TgSpi1 mice at the indicated ages. Bars indicate the mean values. *P<0.05; **P<0.001 from two-tailed Student’s t-tests. (C) Spi1 messenger ribonucleic acid (mRNA) levels in bone marrow cells from 7- and 14-week-old WT, healthy TgSpi1 and sick TgSpi1 mice were quantified via real-time quantitative polymerase chain reaction (qPCR) and normalized to the Polr2α mRNA level (ΔCt, Ctgene-CtPolr2α). Between 4 and 6 animals were analyzed for each category of mice. Bars represent the fold change relative to values for age-matched WT mice, as calculated from the 2−ΔΔCt values. Statistical analysis of the 2−ΔCt values was carried out using Student’s t-test; *P<0.05. (D) Spi1 protein levels in bone marrow cells from 7- and 14-week-old WT, healthy TgSpi1 and sick TgSpi1 mice were analyzed by Western blotting. The histograms represent the quantified results, using ImageJ, relative to β-actin and to values for age-matched WT mice. (E) SA-βgal activity was examined in fresh bone marrow sections. Staining was performed on bone marrow from 7- and 14-week-old WT, healthy TgSpi1 and sick TgSpi1 mice. The number of mice displaying SA-βgal positive cells in their bone marrow is indicated for each category of mice. Bars represent 50μm (top) and 10μm (bottom) pictures. (F) MEP (Lin−Sca−Kit+CD34−CD16/32−) and GMP (Lin−Sca−Kit+CD34+CD16/32+) from bone marrow cells of 7-week-old WT and healthy TgSpi1 mice were analyzed for SA-βgal activity using C12RG as a fluorogenic substrate. The histograms represent the means of percentage of C12RG+ cells in TgSpi1 mice considering WT mice as negative control, as presented in Online Supplementary Figure S10A. N= 4 animals for WT and 5 animals for TgSpi1 mice. Ns: non-significant.

