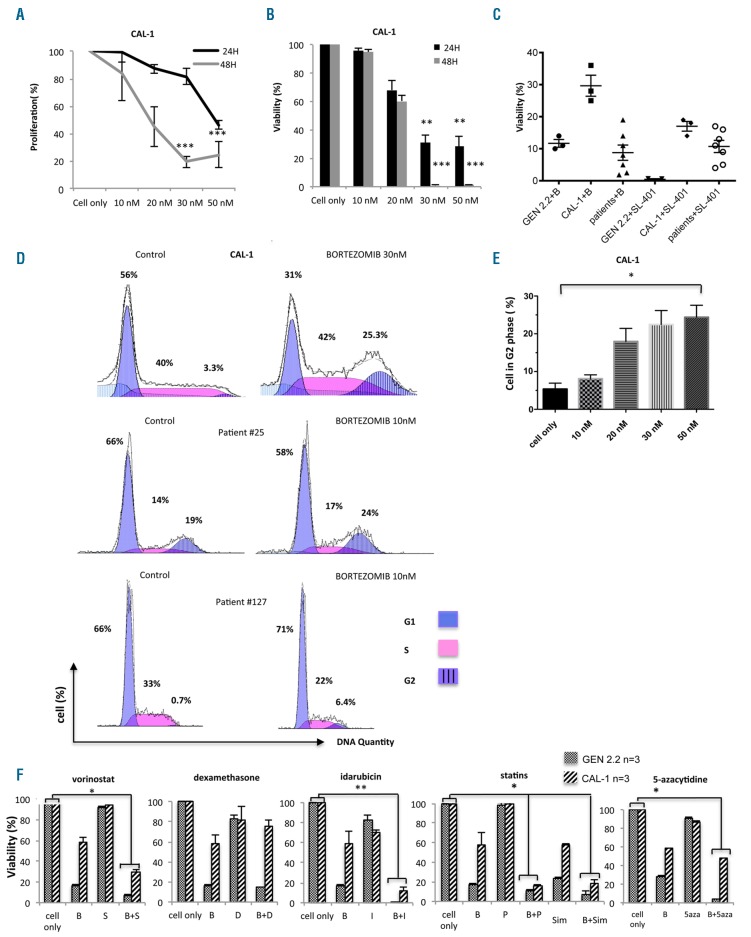
Figure 1.
Bortezomib inhibits cell proliferation and survival of blastic plasmacytoid dendritic cell neoplasm cell lines and primary cells. Results are expressed as percentage ± SEM of (A) proliferation using the Dye eFluor® V450 dilution assay and (B) viable cells using AV−/7-AAD− staining of the CAL-1 cell line treated with bortezomib (10 – 50 nM) for 24 h (black) and 48 h (gray) (n=4). Untreated CAL-1 cells were arbitrarily assigned a value of 100%. (C) Percentage ± SEM of viable GEN 2.2 cells (n=3), CAL-1 (n=6) cells and primary BPDCN cells from seven patients was determined after incubation with bortezomib (30 nM), or SL-401 (365 pM) for 24 h. Untreated cells were considered as 100% viable. (D) One representative histogram showing the percentage of CAL-1 cells and primary cells from two patients (patient #25 and patient #127) in the different phases of the cell cycle: G1, S and G2 after treatment or not with bortezomib at 10 or 30 nM for 24 h. (E) Percentage of cells in the G2 phase in the CAL-1 cell line after treatment or not with bortezomib (10–50 nM) for 24 h (n=4). Histograms represent the mean ± SEM of four independent experiments, *P<0.05, **P<0.01, ***P<0.001 between bortezomib and untreated cells. (F) Percentage of viable CAL-1 (n=3) and GEN2.2 (n=3) cells after incubation with bortezomib (B, 20 nM) in association with: idarubicin (I) at 0.03 μM, dexamethasone (D) at 0.637 mM, vorinostat (S) at 1.25 μM, statins, such as pravastatin (P) and simvastatin (Sim) at 5 μM and 5-azacytidine (5-Aza) at 4 μM. Histograms represent the mean ± SEM of three independent experiments. *P<0.05, **P<0.01.

