Figure 2.
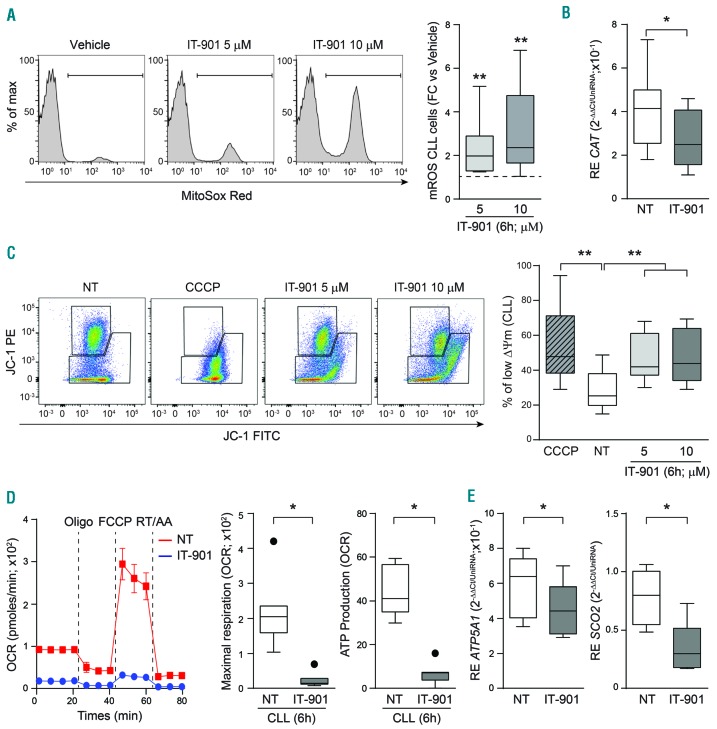
IT-901 induces mitochondrial damage and compromises mitochondrial respiration. (A) Representative plots and cumulative data of mitochondrial reactive oxygen species (mROS) concentration in chronic lymphocytic leukemia (CLL) cells. Data are represented as fold change (FC) over the vehicle (n=10). (B) Box plot reporting the catalase (CAT) mRNA expression levels in vehicle (NT)- or IT-901-treated primary cells (n=10). (C) Representative plots and cumulative data of inner mitochondrial membrane potential (ΔΦm) in primary CLL cells (n=10) exposed to vehicle (NT) or increasing doses of IT-901 for 6 hours (h). CCCP was used as positive control. (D) Dynamic mitochondrial metabolic profile (OCR; pmoles/min) of a representative CLL patient treated with vehicle (red line) or IT-901 10 μM (blue line) for 6 h. Maximal respiration (calculated as: OCR after FCCP injection-late OCR measurement after RT/AA addition) and ATP production (calculated as last rate measurement of OCR before Oligo injection-minimum rate measurement after Oligo injection) in primary CLL patients (n=7). (E) Box plots reporting ATP-synthase (ATP5A1) and Cytochrome C Oxidase Assembly Protein (SCO2) mRNA expression levels in vehicle- or IT-901-treated primary cells (n=7). CCCP: carbonyl cyanide m-chlorophenyl hydrazone; Oligo: oligomycin; FCCP: carbonyl cyanide p-trifluoromethoxyphenylhydrazone; RT/AA: rotenone + antimycin A; OCR: oxygen consumption rate.

