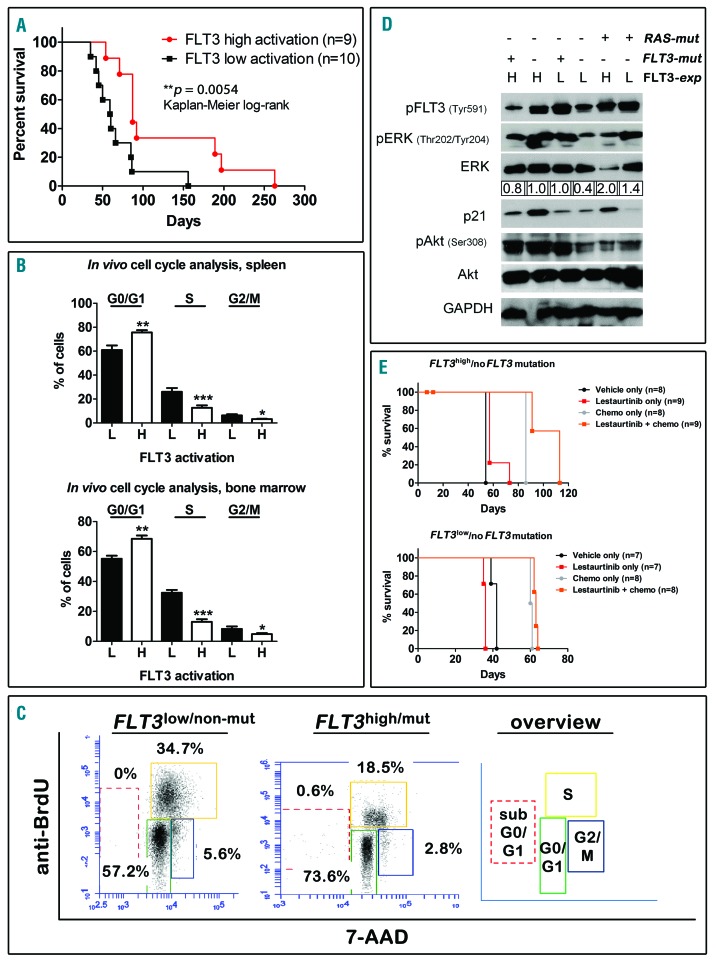
Figure 2.
High FLT3 activation inhibits the growth of KMT2Ar-ALL cells in vivo. Cells from patients with a high and a low FLT3 activation status as indicated were injected into NSG mice and mice were sacrificed upon detection of leukemic symptoms. A: Survival prolongation in mice bearing patients with a high FLT3 activation status (FLT3high/mut, FLT3high/non-mut, FLT3low/mut), Kaplan-Meier log-rank test. B: A subgroup of 3 mice from each group, were fed with BrdU before euthanasia. Human leukemic cells were recovered from the spleens (upper panel) and the bone marrow (lower panel), stained with an anti-BrdU antibody and 7-AAD and FACS analysis was performed. The percentages of cells in the different cell cycle phases are depicted. H = high FLT3 activation status; L = low FLT3 activation status; *P<0.05; **P<0.01; ***P<0.001. C: Representative plots of cell cycle distributions of two samples from both groups as indicated and schematic overview. D: Human leukemic cells were recovered from fully engrafted xenograft spleens. Cells were lysed and subjected to Western Blotting experiments for the markers indicated. H = high FLT3 expression; L = low FLT3 expression. Quantification of the p-Erk/Erk ratio was determined using Image J software. E: Xenograft mice (FLT3high/non-mut, upper panel and FLT3low/non-mut, lower panel) were subjected to treatments with vehicle only, Lestaurtinib, chemotherapy only (dexamethasone, vincristine and PEG-asparaginase), or a combination of chemotherapy and Lestaurtinib, as indicated. Survival curves, Kaplan-Meier log-rank test.

