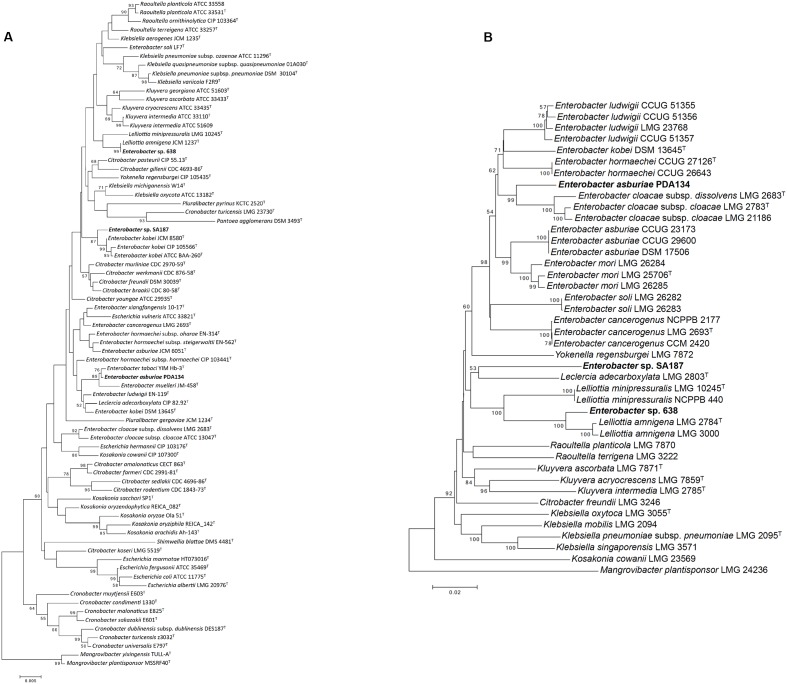
FIGURE 2.
Taxonomic analysis. (A) 16S rRNA based phylogenetic tree. (B) Multilocus sequence analysis (MLSA) based on four housekeeping genes gyrB-rpoB-atpD-infB. The phylogenetic tree was inferred by using the Neighbor-Joining method (Saitou and Nei, 1987), and the optimal tree is shown. The percentage of replicate trees in which the associated taxa clustered together in the bootstrap test (1000 replicates) is shown next to the branches (bootstrap >50 is shown) (Felsenstein, 1985). The tree is drawn to scale, with branch lengths in the same units as those of the evolutionary distances used to infer the phylogenetic tree. The evolutionary distances (number of nucleotide substitutions per site) were computed using the Kimura-2-parameter method (Kimura, 1980). All ambiguous positions were removed for each sequence pair. There was a total of 2,636 positions in the final dataset.

