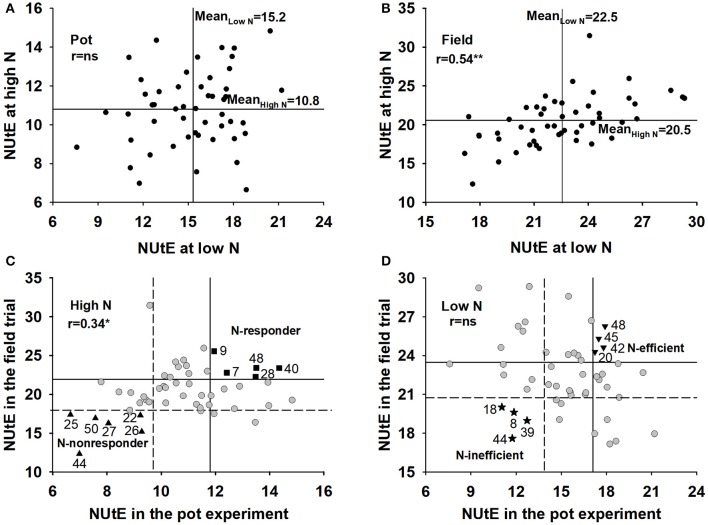
Figure 1.
Mean NUtE for 50 oilseed rape genotypes under high and low N supply in a the pot experiment (A) and a the field experiment (B), selection for N-responder and N-nonresponder genotypes at high N rates in the pot and field experiments (C) and N-efficient and N-inefficient genotypes at low N rates in the pot and field experiments (D). NUtE intervals at four standard errors of the genotype effect above and below the median are indicated by vertical lines in the pot experiment (C,D) and by horizontal lines in the field experiment (C,D).The horizontal line represents the mean of the genotypes in the pot experiment and the vertical line represents the mean in the field experiment (A,B). r means Pearson Coefficient correlations between x axis and y axis. ns means not significant; *means significant at p < 0.05.

