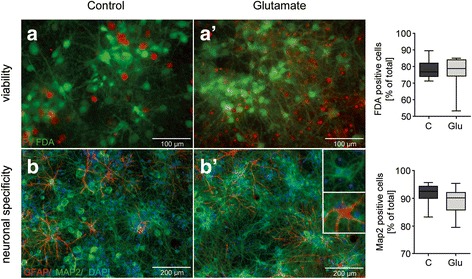
Fig. 2.

Effect of glutamate treatment on cell viability, morphology and specificity using bright field and fluorescence microscopy. a Live/dead double-staining of neuronal culture based on differential uptake of PI and FDA 4 weeks after treatment. Vital cells stained green whereas dead cells stained red. No difference was seen between the number of surviving cells following glutamate treatment compared to time-matched sham controls (p > 0.05). b Cell morphology of neurons 4 weeks after glutamate injury was imaged by bright field light microscopy. Double-immunofluorescent staining of cultured cells with neuronal marker MAP2 (green) and glial marker GFAP (red) 4 weeks after glutamate treatment is shown. Nuclei were counterstained using DAPI (blue). No difference was seen between the relative number of neuronal cells in our preparations following glutamate treatment compared to time-matched sham controls (p > 0.05)
