
Fig. 5.
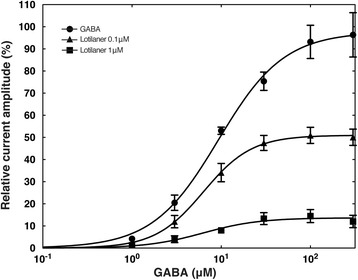
Lotilaner function as a non-competitive antagonist of DmS-GABA receptors. Concentration-response plots for GABA alone (black circle), GABA in the presence of 0.1 μM lotilaner (black triangle), and GABA in the presence of 1 μM lotilaner (black square). EC50 and Rmax values were 9.29 ± 0.81 μM and 97.706 ± 2.45% (n = 5) for GABA, 6.33 ± 0.20 μM and 50.98 ± 0.47% (n = 5) in 0.1 μM lotilaner, and 6.27 ± 1.85 μM and 13.65 ± 1.12% (n = 4) in 1 μM lotilaner. Individual curves were standardized to an initial 100 μM GABA application and subsequently averaged. Mean ± SEM is shown