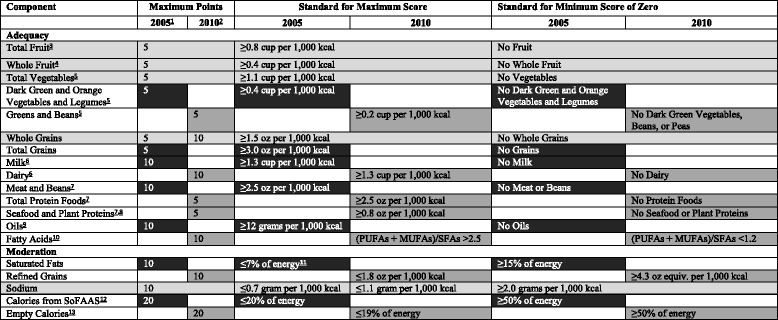
Table 4.
Comparison of components and scoring standards in the HEI-2005 and HEI-2010 [10]

Light gray rows indicate components found in both the HEI–2005 and HEI–2010; Black rows indicate components found only in the HEI–2005; Dark gray rows indicate components found only in the HEI–2010
aIntakes between the minimum and maximum standards are scored proportionately except for Saturated Fat and Sodium
bIntakes between the minimum and maximum standards are scored proportionately
cIncludes 100% fruit juice
dIncludes all forms except juice
eIncludes any beans and peas (called Legumes in HEI–2005) not counted as Total Protein Foods (called Meat and Beans in HEI–2005)
fIncludes all milk products, such as fluid milk, yogurt, and cheese, and fortified soy beverages
gBeans and peas are included here (and not with vegetables) when the Total Protein Foods (called Meat and Beans in HEI–2005) standard is otherwise not met
hIncludes seafood, nuts, seeds, soy products (other than beverages) as well as beans and peas counted as Total Protein Foods
iIncludes non-hydrogenated vegetable oils and oils in fish, nuts, and seeds
jRatio of poly- and monounsaturated fatty acids to saturated fatty acids
kSaturated Fat and Sodium get a score of 8 for the intake levels that reflect the 2005 Dietary Guidelines, <10% of calories from saturated fat and 1.1 g of sodium/1,000 kcal, respectively. Intakes between the standards for scores of 0 and 8 and between 8 and 10 are scored proportionately
lCalories from solid fats, alcoholic beverages, and added sugars
mCalories from solid fats, alcoholic beverages, and added sugars; threshold for counting alcohol is >13 g/1,000 kcal
