Figure 3.
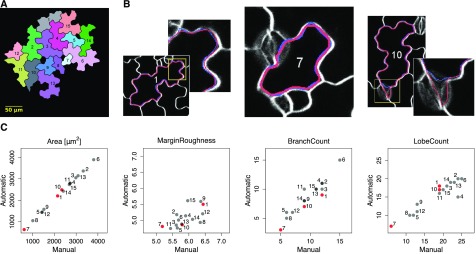
Comparison between automatic and manual segmentation of cells based on PaCeQuant features. A, Sample image containing 15 individual cells, which were segmented fully automatically and manually. Numbers correspond to cell identifiers. B, Overlay of cell outlines detected by automatic (red) and manual (blue) segmentation for sample cells with high congruence and different cell sizes (left, ID 1, large cell; and middle, ID 7, small cell) and with local deviations (right, ID 10). C, Scatterplots of one exemplary feature for each of the four feature groups (see Fig. 2 and Supplemental Table S1) from a pairwise comparison between automatic and manual segmentation of all 15 cells. Cells shown in B are highlighted in red (for a summary of all features, see Supplemental Fig. S2).

