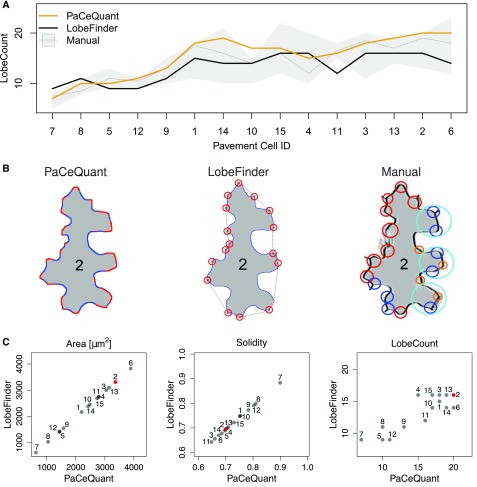
Figure 4.
Evaluation of lobe detection accuracy by comparison between PaCeQuant results with LobeFinder and manual lobe counting. A, Number of lobes detected in the 15 sample cells (ID 1–ID 15) after automatic segmentation by PaCeQuant (orange), LobeFinder (black), and by manual lobe counting (gray). For manual counting, lobes were analyzed by four independent researchers. The gray line represents the mean lobe number per cell of the four measurements; the gray strip represents the range of the independent measurements. Cells are sorted by their area from small (left) to large (right). B, Lobe count results in one exemplary cell (ID 2) analyzed with PaCeQuant (left, 20 lobes), LobeFinder (middle, 16 lobes), and manually (right, 13–20 lobes). Lobes identified by PaCeQuant or LobeFinder are marked in red. Lobes identified manually are marked in red (nine lobes), blue (eight lobes), pink (four lobes), and turquoise (three lobes) if identified by four, three, two, or at least one person, respectively. C, Pairwise comparison of features computed by PaCeQuant and LobeFinder in the sample set of the 15 automatically segmented cells. Scatterplots are shown for area, solidity, and lobe count (for a summary of all features, see Supplemental Fig. S3). The cell shown in B is highlighted in red.

