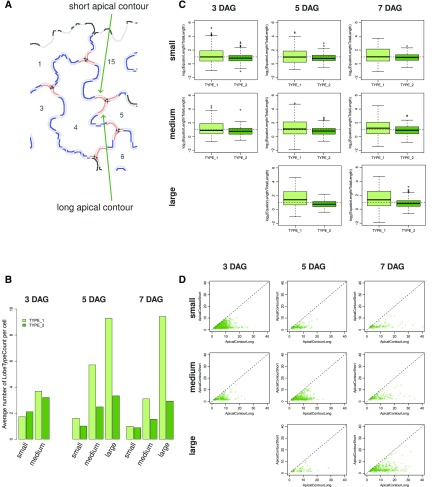
Figure 6.
Analysis of type I and type II lobes and quantification of lobe characteristics. A, Image of an exemplary group of adjacent PCs after neighborhood analysis of individual lobes. Apical contours of type I and type II lobes are shown in blue and red, respectively. In type II lobes, three-cell contact points (shown as black dots) separate the lobe contours corresponding to the contact sides with the two neighboring cells (referred to as short and long contour segments). B to D, Analysis of lobe characteristics in PCs from the three developmental time points (3 DAG, 5 DAG, and 7 DAG) and the three size categories (small, medium, large; see Fig. 5). For an overview of quantified lobe features and statistical analysis, see Supplemental Figure S6. B, Bar plots showing the average number of type I (TYPE_1) and type II (TYPE_2) lobes per PC. C, Average ratio of lobe equator length to total contour length in type I and type II lobes in a logarithmic scale. D, Analysis of the length of the two parts of type II lobe contours that span the distances from the lobe equator to the three-cell contact point. Scatterplots of all individual type II lobes compare the short (ApicalContourShort) and long (ApicalContourLong) fragments.

