Figure 6.
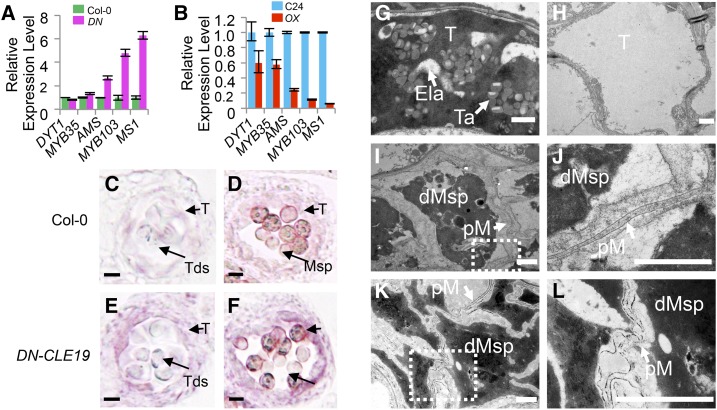
Quantitative real-time PCR and RNA in situ hybridization analyses to test the expression of AMS and downstream transcription factor genes in DN-CLE19 and CLE19-OX transgenic anthers, and TEM observation of CLE19-OX and ams tapetal cells and microspores. A and B, Relative expression levels of the transcription factor genes DYT1, MYB35, AMS, MYB103, and MS1 in DN-CLE19 and CLE19-OX mutants compared with related wild-type plants, with ACTIN expression as an internal control. C and D, Expression of AMS in wild-type anthers. E and F, Expression of AMS in DN-CLE19 anthers. C and E show anther stage 7, and D and F show anther stage 10. G to L, Tapetal cells of wild-type and CLE19-OX-S anthers visualized by TEM. G, The wild type. H, CLE19-OX-S. I to L, Microspore cells of CLE19-OX-S and ams anthers visualized by TEM. I and J, CLE19-OX-S. K and L, ams. dMsp, Degenerated microspores; Ela, elaioplasts; pM, primexine; T, tapetum; Ta, tapetosomes. Bars = 1 μm.

