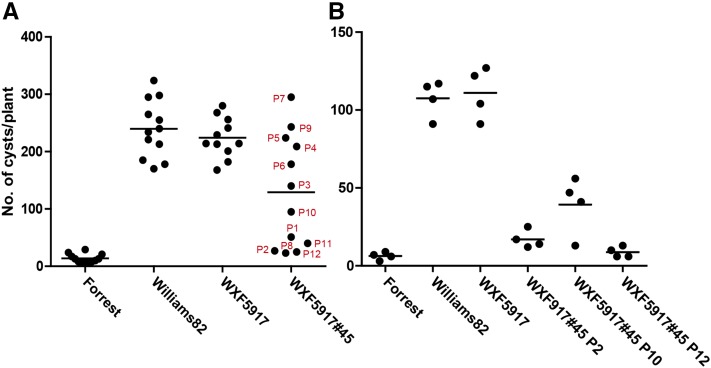
Figure 1.
Characterization of GmSHMT08 complemented transgenic soybean plants. A, SCN phenotype of T1 plants. Each dot corresponds to the number of cysts on an individual plant. B, SCN phenotype of plants in the T2 generation. The seeds from T1 plants P2, P10, and P12 were used in the greenhouse assay. Each dot corresponds to the number of cysts on an individual plant.

