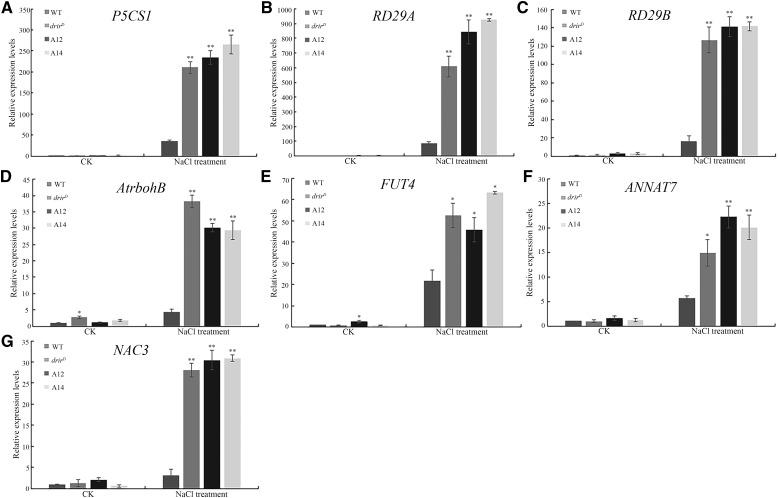
Figure 8.
Relative expression levels of selected genes in salt stress-treated seedlings. RNA was extracted from 10-d-old seedlings that were treated with 200 mm NaCl for 3 h, and gene expression level was measured by RT-quantitative PCR normalized against the 18S rRNA gene. Relative expression levels are shown for P5CS1 (A), RD29A (B), RD29B (C), AtrbohB (D), FUT4 (E), ANNAT7 (F), and NAC3 (G). CK, controls without NaCl treatment. *, P < 0.05 and **, P < 0.01 by Student’s t test compared with untreated (CK) or salt-treated wild-type (WT) seedlings. Data represent means ± sd.

