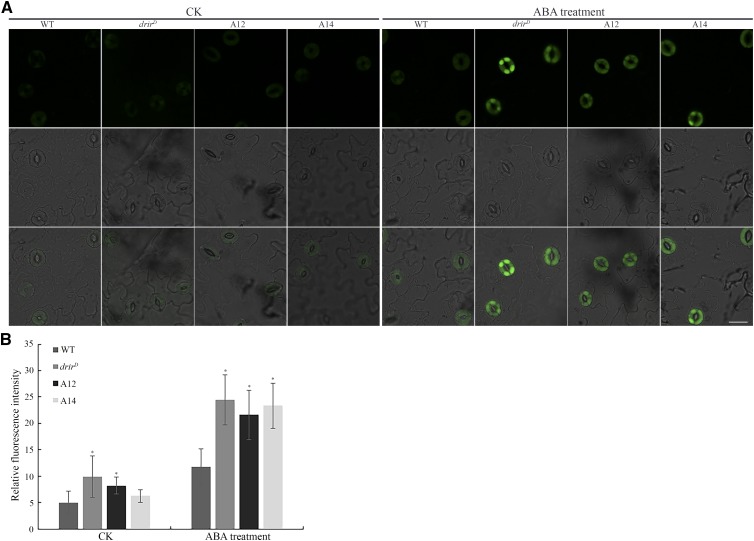
Figure 9.
More ROS accumulated in guard cells of drirD and overexpressing leaves in response to ABA treatment. A, Representative images of ROS production stained by the fluorescent dye H2DCF-DA in guard cells without (left) or with (right) ABA treatment. Top row, Fluorescence images; middle row, bright-field images; bottom row, merged images. Bar = 20 µm. B, Relative fluorescence intensity of H2DCF-DA. More than 100 guard cells from 10 leaves of each genotype were measured. CK, controls without ABA treatment. *, P < 0.05 by Student’s t test compared with untreated or ABA-treated wild type (WT) seedlings. Error bars represent sd.

