Figure 7.
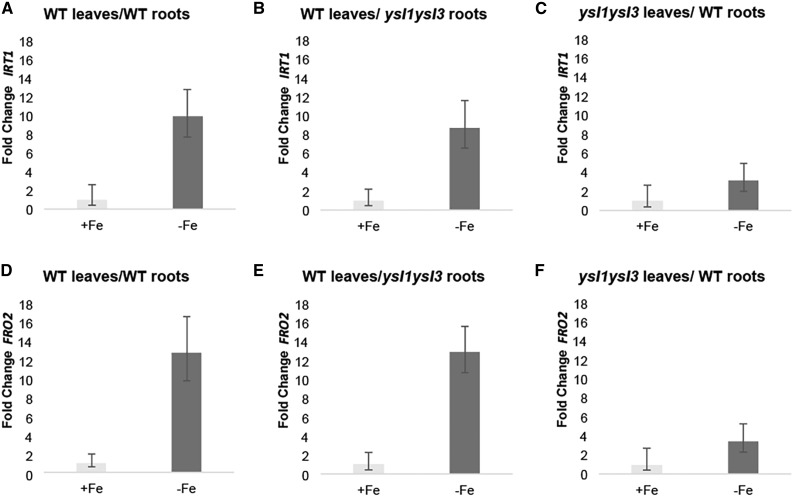
qRT-PCR analysis of grafted plants. Samples were prepared from roots of the indicated graft combinations that were transferred to +Fe (control) and –Fe conditions for 72 h. Fold change in expression relative to the +Fe control for each graft type is shown. Error bars indicate 95% confidence intervals. Graft combinations are expressed as shoot/root. A, IRT1 expression in roots of wild-type (WT)/wild-type grafts. B, IRT1 expression in roots of wild-type/ysl1ysl3 grafts. C, IRT1 expression in roots of ysl1ysl3/wild-type grafts. D, FRO2 expression in roots of wild-type/wild-type grafts. E, FRO2 expression in roots of wild-type/ysl1ysl3 grafts. F, FRO2 expression in roots of ysl1ysl3/wild-type grafts.

