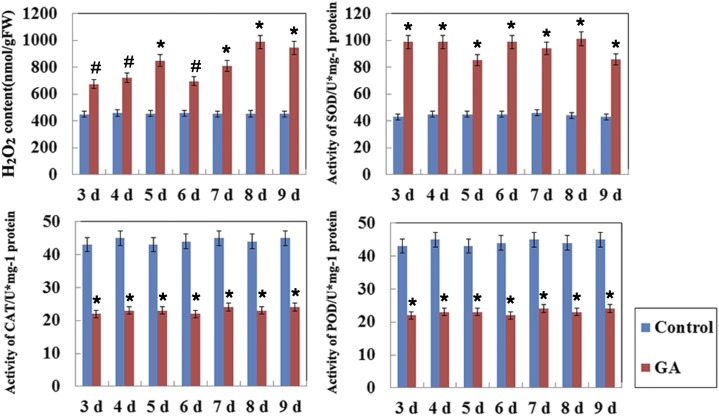
Figure 4.
Concentration of ROS-related molecules and enzyme activities after GA treatment in aleurone layers. Each assay was repeated three times for every sample in three independent experiments. Control, Distilled, deionized water; FW, fresh weight. Error bars represent se (n = 3). #, P < 0.05 and *, P < 0.01 versus the control group according to Student’s t test.

