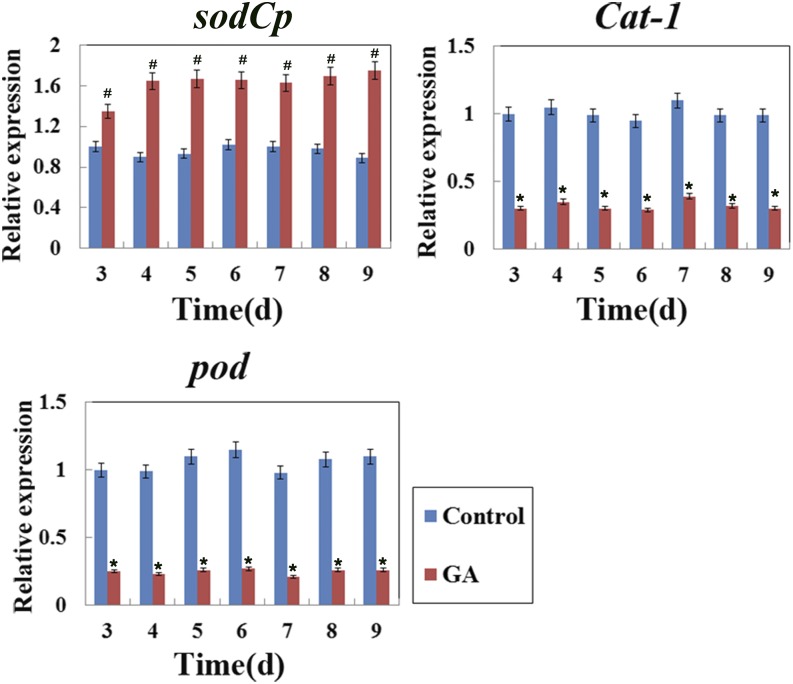
Figure 7.
Quantitative real-time PCR analysis of ROS-related genes at different time points in maize aleurone layers during the PCD process with or without GA. The relative expression value of the control group (3 d) was defined as 1. The ubiquitin gene was used as an internal control. Control, Distilled, deionized water. Each assay was repeated three times for every sample in three independent experiments. Error bars represent se (n = 3). #, P < 0.05 and *, P < 0.01 versus the control group according to Student’s t test.

