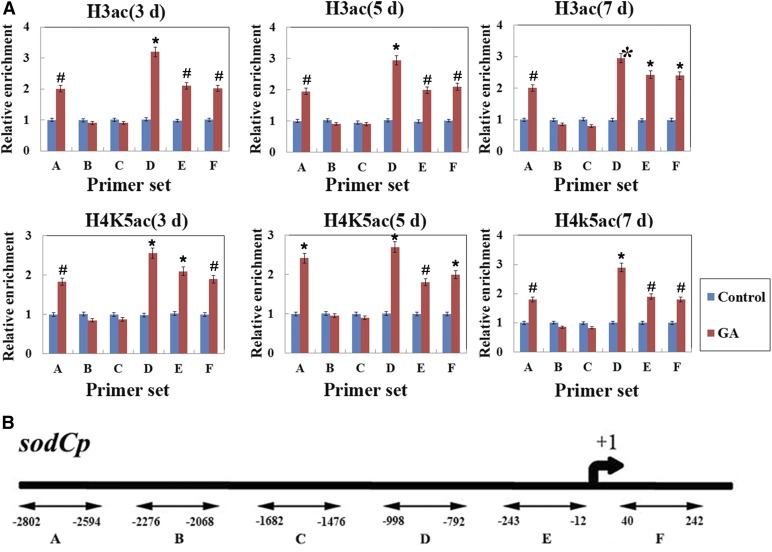
Figure 8.
Chromatin immunoprecipitation (ChIP) results of sodCp. A, H3ac and H4K5ac levels in the promoter regions (sets A–E) and the exon (set F) of the sodCp gene after GA treatment in maize aleurone layers during the PCD process. The x axis indicates time, and the y axis indicates relative expression values. The relative expression value of the control group (set A) was defined as 1. The ubiquitin gene was used as an internal control. B, Schematic representation of the sodCp gene from −2,802 to +242 bp. Control, Distilled, deionized water. Each assay was repeated three times for every sample in three independent experiments. Error bars represent se (n = 3). #, P < 0.05 and *, P < 0.01 versus the control group according to Student’s t test.

