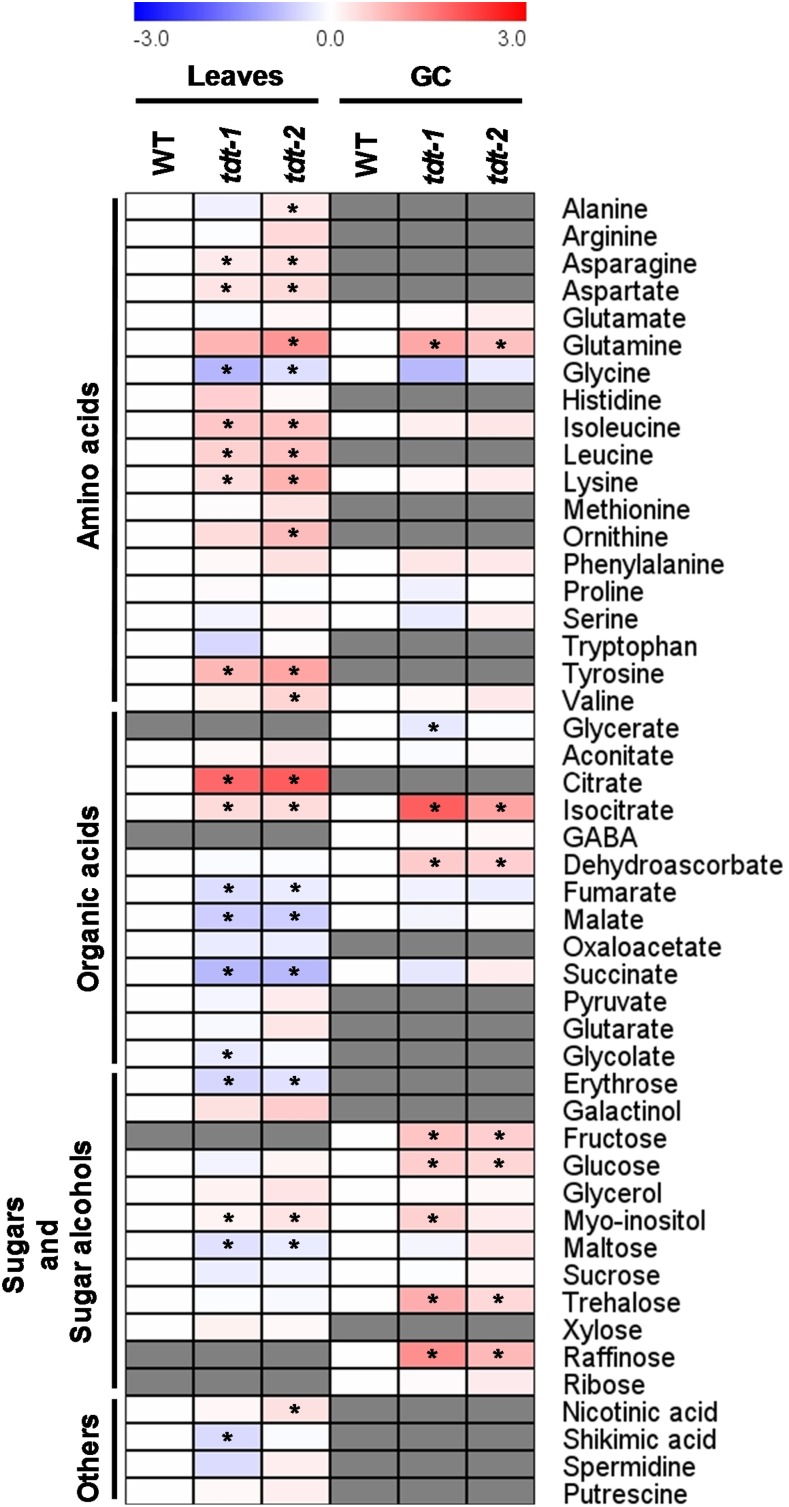
Figure 4.
Heat map representing the changes in relative metabolite contents in leaves and guard cell-enriched epidermal fragments (GC) from wild-type (WT) and tdt plants. The full data sets from these metabolic profiling studies are available in Supplemental Table S6. The color code of the heat map is given at the log2 following the scale above the diagram. Data are normalized with respect to the mean response calculated for the wild type (to allow statistical assessment, individual plants from this set were normalized in the same way). Values are presented as means ± se (n = 5). Asterisks indicate that the values from mutant lines were determined by Student’s t test to be significantly different (P < 0.05) from the wild type. Gray cells indicate metabolites that were not detected or could not be annotated. GABA, γ-Aminobutyrate.

