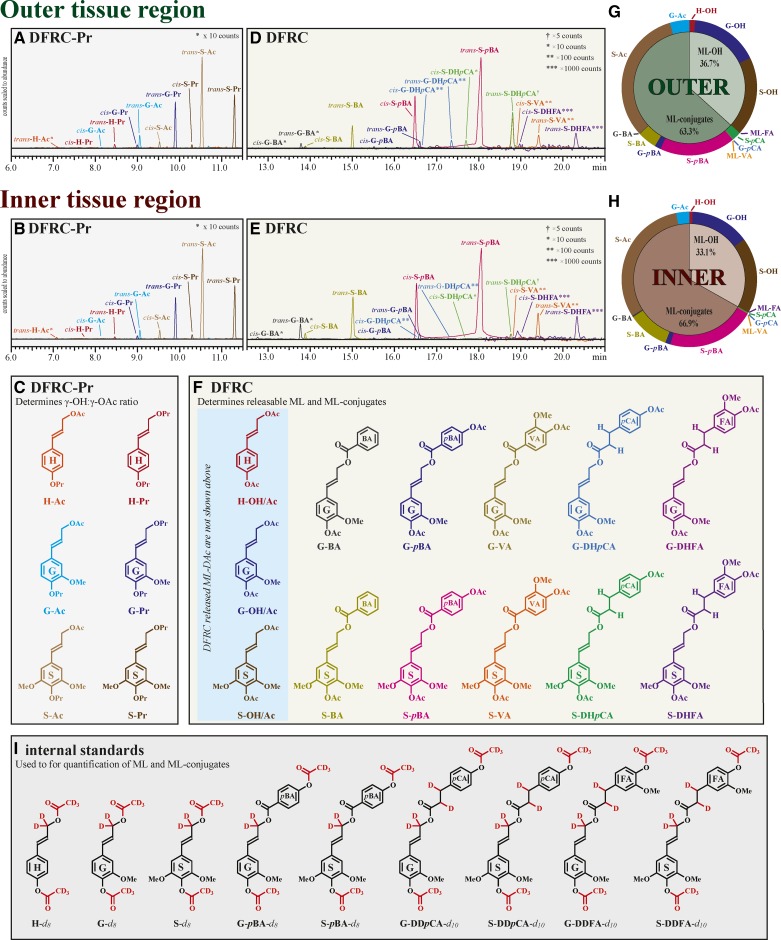
Figure 3.
DFRC and DFRC-Pr of the leaf base tissue regions reveal the compositional complexity and tissue region specificity of the lignin composition. The DFRC-Pr multiple reaction monitoring (MRM) chromatograms of the outer (A) and inner (B) tissue regions elucidated the ratio of γ-hydroxyl (ML-Pr) to γ-acetate (ML-Ac) on the monolignols (C). The DFRC MRM-chromatograms (D and E) show the compositional complexity of the leaf base lignins (F). The signal intensities in these composite chromatograms have been scaled to be representative of abundances, with low-level components scaled to ×5 (†), ×10 (*), ×100 (**), and ×1,000 (***) counts. The pie charts (G and H) provide a visual of the distribution of the ML and ML-conj released by DFRC/DFRC-Pr. The detected products from DFRC-Pr (C), DFRC (F), and the internal standards (I) are shown with their respective abbreviations.

