Figure 4.
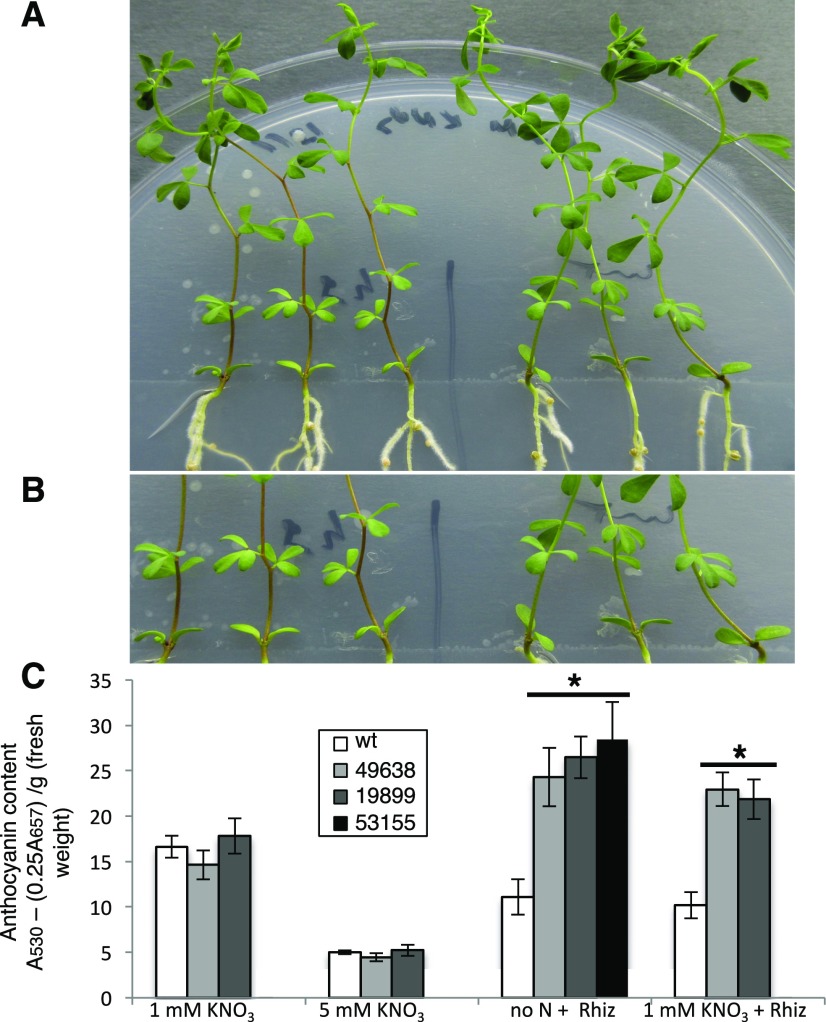
Analysis of anthocyanin content. A, Three representative wild-type and 49638 plants are shown on the right and left sides of the petri dish, respectively. B, Higher magnification showing intense purple colors in the stems of mutant plants (on the left). C, Anthocyanin content in stems of wild-type (wt) and LORE1 lines. The different KNO3 concentrations and, when determined, M. loti inoculations are indicated. Bars corresponding to wild-type and different LORE1 plants are indicated. Data bars represent means and se of measures from three experiments (12 plants per experiment per condition). Data in C were scored 28 d after inoculation. Asterisks indicate significant differences (P < 0.001) from wild-type levels.

