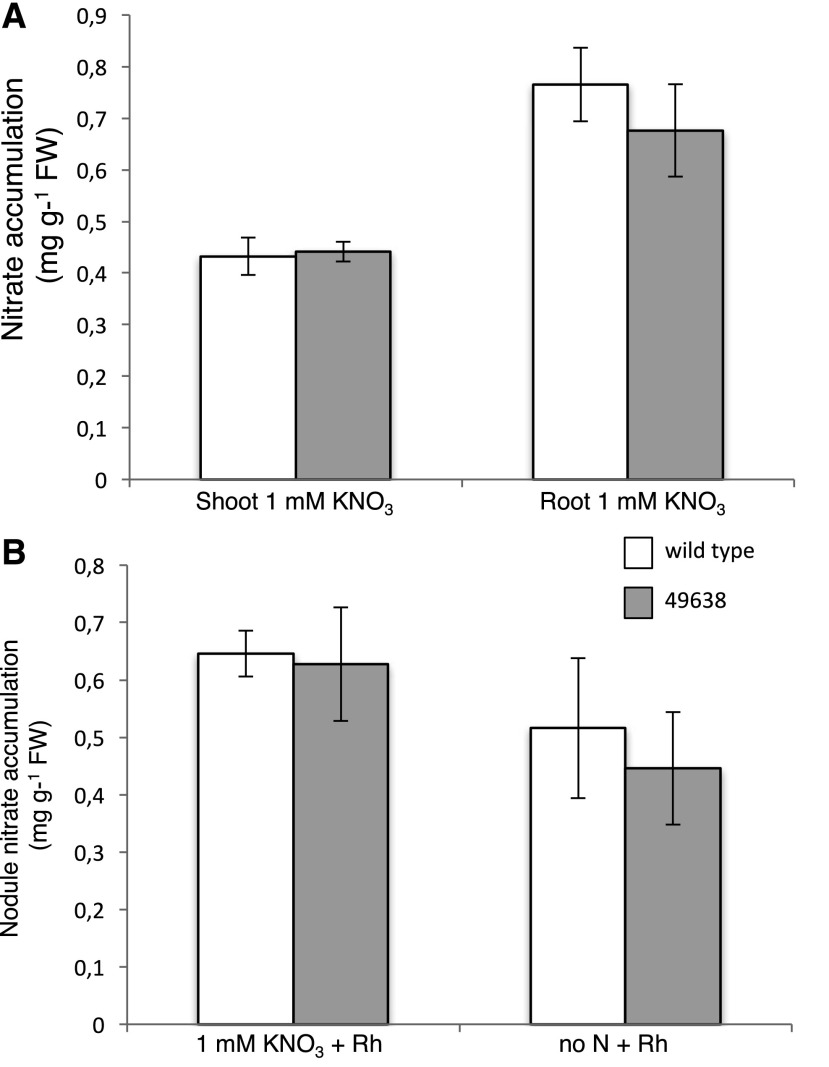
Figure 8.
A, Nitrate content of shoots and roots from wild-type and 49638 plants grown on 1 mm KNO3 and inoculated with M. loti. Data bars represent means and se from three independent samples (10 plants per sample). B, Nitrate content in wild-type and 49638 4-week-old nodules. Data bars represent means and se of nodules from three independent samples (10 plants per sample). Bars corresponding to wild-type and 49638 plants are indicated. FW, Fresh weight.

