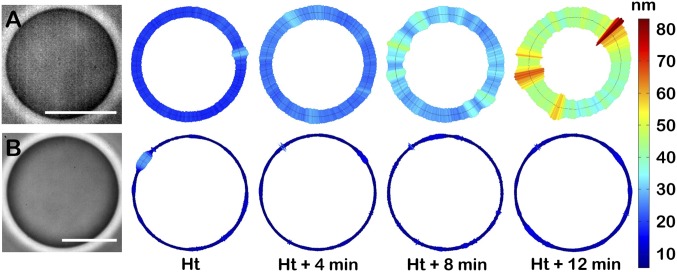
Fig. 2.
Membrane fluctuations of single D-F1F0-GUVs. Typical membrane fluctuation maps of a single D-F1F0-GUV at different time intervals (Ht, handling time) under (A) active conditions and (B) passive conditions. Scale bar represents the SD value (RMSD in nanometers) of the local membrane fluctuations measured in real space at the equatorial vesicle plane as h(i,t) − h0, where h accounts for the time membrane position i and h0 is the time average value. For illustration, see Movie S1.

