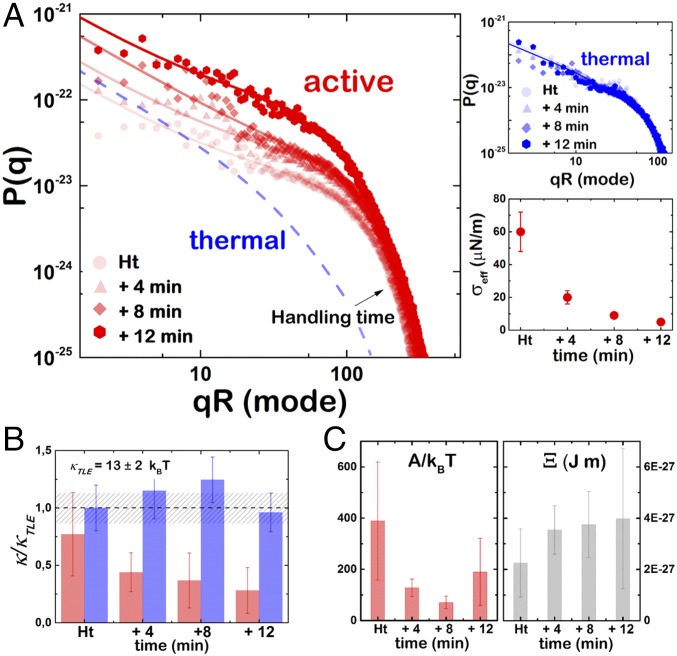
Fig. 4.
Fluctuation spectrum and mechanical properties. (A) Experimental fluctuation spectra obtained for a typical active D-F1F0-GUV at different time intervals after valinomycin incubation. Solid lines represent the best fit to Eq. 2. The dashed line represents the fit to Eq. 1 for the passive case (t = Ht) as shown in Top Right. (Top Right) Experimental fluctuation spectra obtained for a typical passive D-F1F0-GUV at different time intervals. Solid lines represent the best fit to Eq. 1. (Bottom Right) Variation of the effective surface tension σ at different time intervals after valinomycin incubation. (B) Variation of the population-averaged bending rigidity, κ, of active (red, n = 23) and passive (blue, n = 33) D-F1F0-GUVs measured at different time intervals. Bending rigidity is normalized to the bending rigidity measured for pure lipid EcGUVs, κTLE. The dashed region represents the dispersity on the lipid bending modulus, κTLE. (C) (Left) Variation of the effective activity, A, of active (red, n = 23) D-F1F0-GUVs at different time intervals. (Right) Variation of the coupling parameter (Ξ) at different time intervals after valinomycin incubation.

