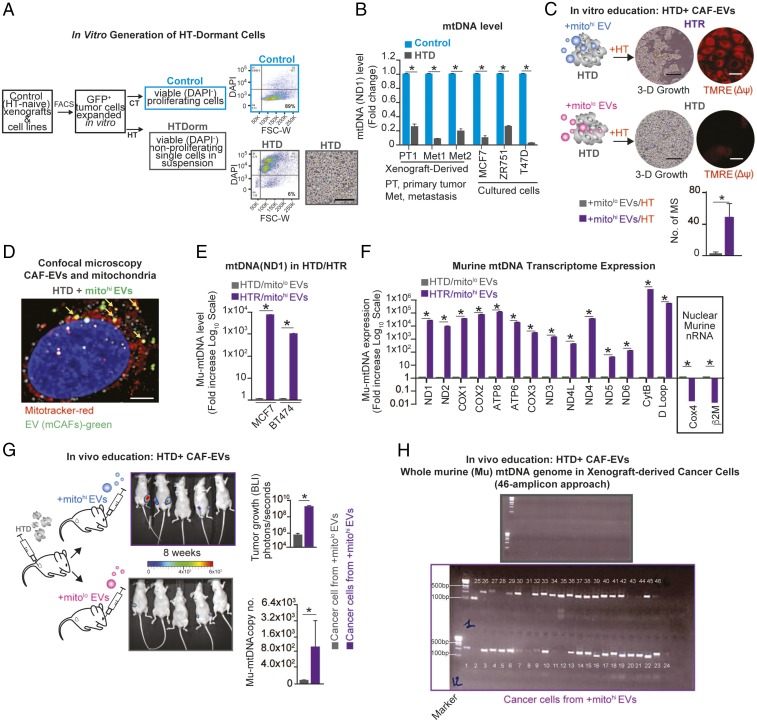
Fig. 5.
mCAF-derived EVs promote the exit from HT-induced tumor dormancy. (A) Schematic of the experimental design and representative flow plots: HT-naive cells were FACS isolated from xenografts (GFP+) or luminal breast cancer cell lines and were treated with HT (fulvestrant, 10 μM/wk) for 2 mo; HTD cancer cells (6% of the viable population, HTDorm) were FACS purified (Dapi−) and displayed a single-cell (nonproliferating) morphology in 3D. (Scale bar,100 μm.) (B) mtDNA levels (determined by qPCR and expressed as fold change; naive cells were used as reference) in luminal breast cancer cells and xenograft-derived cells (multiple models) ± HT (fulvestrant, 10 μM) for 2 mo. (C) Dormant MCF7 cells (HTD) were isolated (SI Appendix, Fig. S5) and treated weekly for 4 wk with 3 × 10⁹ mCAF-derived EVs (wt-mtDNAhi or ρ0-mtDNAlo) + HT (fulvestrant, 10 μM/wk). After 40 d, mammosphere (MS) number and mitochondrial membrane potential (Δψ) were determined by TMRE staining (red) in HTR/mitohi-EV– and HTD/mitolo-EV–educated cells. (Scale bars, 15 μm.) (D) Confocal microscopy of HTD cells incubated for 48 h with PKH67 Green-labeled mCAF EVs (green), MitoTracker-labeled mitochondria (red), and EVs colocalized with mitochondria (yellow). (Scale bar, 5 μm.) (E) Mu-mtDNA level (qPCR, ND1) shown as the fold increase (log10 scale) of the reference HTD from the two HTD–HTR models (MCF7 and BT474) described in C. (F) Mu-mtRNA expression of 14 genes (shown as fold change, −log10 scale) determined by qRT-PCR in HTR and HTS cells in E (reference HTD cells; MCF7); the expression of nuclear-encoded (nonmitochondrial) murine RNA transcripts was also determined (Cox4, β2M). (G) Schematic, representative photographs, and bar graph showing BLI of tumor growth derived from HTD cells (ZR751 GFP+/Luciferase+ cells) injected in the MFP of mice (n = 5 per group) that were treated weekly for 8 wk via retroorbital injection with 3 × 10⁹ wt-mitohi or ρ0-mitolo mCAF-derived EVs. Data are shown as mean ± SD at the end point (4 mo); *P < 0.05 (student’s t test). The mu-mtDNA level is reported as the copy number (qPCR, ND1) in FACS-purified ZR751 EV-educated cells at the end point of the experiment. (H) Representative gel electrophoresis from whole mu-mtDNA PCR amplification using a set of nuclear mitochondrial sequences (NumtS) excluding overlapping primers in cancer cells from G (grey, mitolow EV-derived tumor cells; purple mitohi EV-derived tumor cells) (Materials and Methods). Data in B, C, and E–G are reported as the mean of three independent experiments; error bars indicate SD; In B, C, E, and F, *P < 0.05 (student’s t test).

