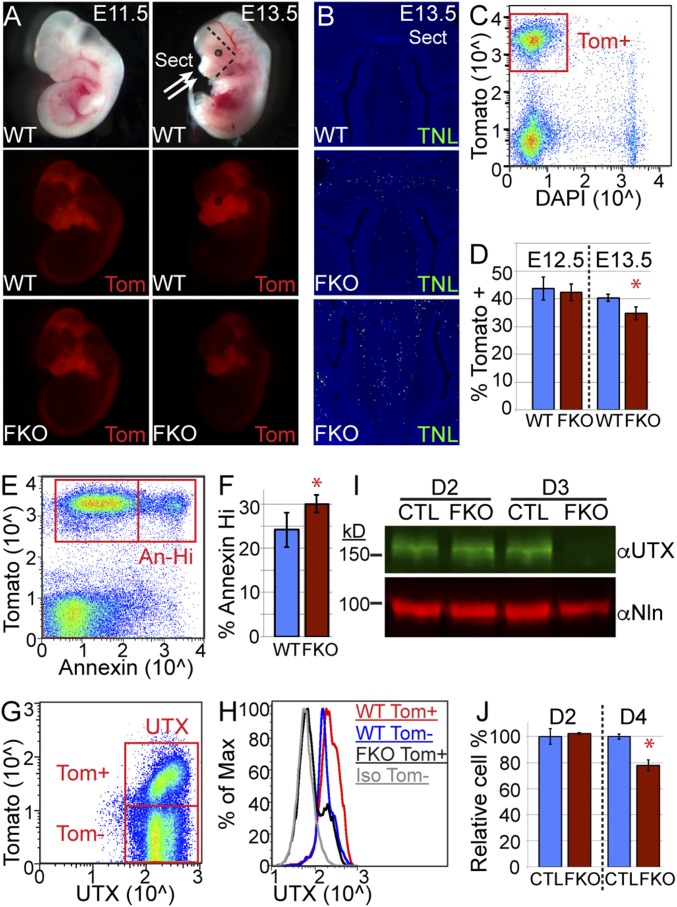
Fig. 3.
UTX regulates postmigratory embryonic neural crest viability. (A) Tomato (Tom), activated in NC by Wnt1-Cre, traced NC embryonic development at E11.5 and E13.5. (B) Tunel assay (TNL) of E13.5 WT and FKO anterior facial regions (depicted in Fig. 4A: Sect). (C) Anterior facial regions were dissected (dashed lines in Fig. 4A), dissociated, and flow sorted to isolate live (DAPI excluded) cranial NC cells (Tom+). (D) FKO experience loss of relative NC cell percentages at E13.5 (t test *P = 0.01). (E and F) Tom+ E13.5 cranial NC were stained for annexin V and gated on annexin high (An-Hi) populations to determine relative percentage (t test *P < 0.05). (G and H) Tom+ or Tom− cranial NC were stained for UTX and plotted as a histogram (Iso, isotype antibody). (I) O9-1 NC cells were transduced with CRISPR lentivirus for UTX (FKO) or a control guide RNA (CTL), selected for the given number of days, and Western blotted for UTX or nucleolin (Nln). (J) Cell numbers were quantified with CellTiter-Glo at given timepoints. FKO was graphed as a relative percentage of CTL (t test *P < 0.02).

