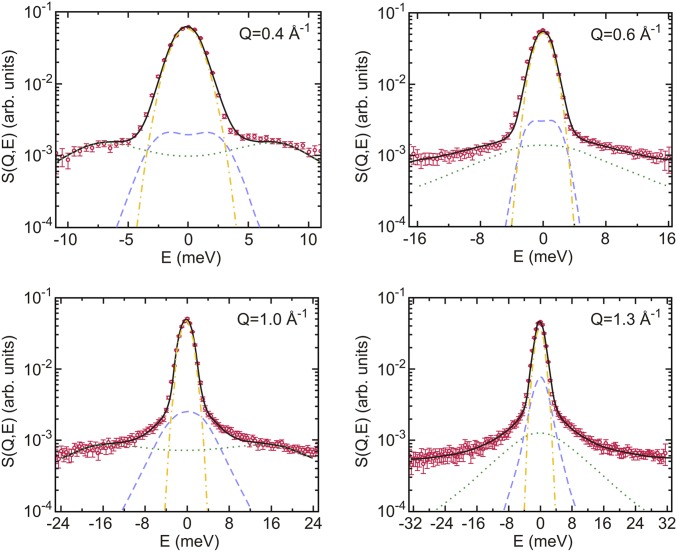
Fig. 1.
Coherent inelastic spectra of lysozyme solution at 2 kbar at selected Q values. The thick black line shows fits of the two-component DHO model (see SI Appendix for details). The dashed blue and dotted green lines represent the resulting low- and high-frequency DHO, respectively. The dashed–dotted yellow line shows the experimental resolution function.

